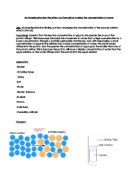
Diagram:
Variables:
Dependent Variables- The dependent variable would be the percentage change in mass of the potato because with the different concentration solutions, osmosis happens differently.
Independent Variables- The independent variable would be the concentration of the solution because we are checking to see if the change in concentration effects Osmosis.
Controlled Variables- The controlled variables would be the volume of solution, the shape (surface are) of the potato, type of potato. We want to control the surface area of the potato and the type of potato we are using because changing the surface area of a potato can effect the results.
Method:
- Cut the potato into 6 cylinder slices using a cork borer, and calculate the initial mass of the potato pieces using an electrical balance.
-
Make a 100 mL of 1 Mol concentration of salt solution by adding 2.3 grams of sugar to 100 mL of water.
- The table below shows the amount of salt solution and water that will be added to each boiling tube.
- In the six boiling tubes, place a potato into each boiling tube.
- Pour each different salt concentration into a boiling tube. Seal each boiling tube with a bung.
- Leave the boiling tubes for 24 hours.
- Remove the potatoes from the boiling cylinder one at a time and let each potato cylinder damp dry to get rid of extra water drops, and record the mass of each potato cylinder on the electrical balance.
- Repeat this three more times, from step 1 and 3-10.
Results:
Calculations:
-
Difference in mass of potato cylinder: Final mass of potato – Initial mass of potato=
1.06 – 0.90 = 0.16 grams
-
Percentage change in potato mass: (change in mass/initial mass) * 100=
(0.16/0.90) * 100 = 17.78%
- Average Percentage change
(17.78% + 25.64 + 18.60) / 3 = 20.67
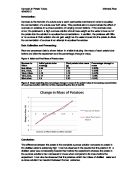
Graph:
Conclusion:
It is concluded that as the salt concentration increases, the percentage change in mass decreases to a point where the percentage change is negative. This is because when the molar concentration is 1, the water concentration in the potato is greater than the water concentration in the salt solution. So the water diffuses from the potato into the salt solution, trying to balance out the water concentration in both substances while water continuously diffuses back and forth. As the molar concentration decreases, the greater the percentage change in mass becomes, this is because with the molar concentration decreasing, the water concentration increases having more water diffusing into the potato than out. From the graph you can see that with the molar concentration being 1, the percentage change in mass is the greatest, because the solution is packed with salt molecules and so much more water diffuses into the solution than into the potato.
Evaluation
The graph showed in the results is what I predicted would happen, so this suggests that the experiment was fairly accurate. The accuracy of the investigation was adequate, but when each potato was damp dried to get rid of excess water, each potato was not was not necessarily done the same, and they were dried a more accurate way it could improve the accuracy of the experiment. Doing three trails for each solution increased the accuracy, but for at least one trial in each concentration there was an anomalous result, that was that was over 5% greater.