Observations
Raw Data Tables
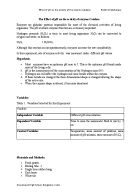
The table shows the volumes recorded of oxygen gas produced from the reaction of hydrogen peroxide with one disc of beef liver
The table shows the volumes recorded of oxygen gas produced from the reaction of hydrogen peroxide with three discs of beef liver
The table shows the volumes recorded of oxygen gas produced from the reaction of hydrogen peroxide with five discs of beef liver
The uncertainty for time is the average recorded reaction time for humans (http://biology.clemson.edu/bpc/bp/Lab/110/reaction.htm#Mean%20Times).
Qualitative Observations
When the reaction took place the reaction vessel became warmer and the sounds of bubbles forming were heard. The reaction produced white oxygen gas bubbles. As the number of discs increase so did the temperature and sound of bubbles forming.
Processed Data:
Sample Calculation for one disc:
To calculate the average volume produced of oxygen gas, all the volumes for each interval of time must be added then divided by 5. For example the volumes recorded for 10 seconds of one disc are 4.6mL, 5.9mL, 6.8mL, 3.8mL, and 4.0mL.
4.6+5.9+6.8+3.8+4.0=25.1
25.1/5= 5.0 mL So the average volume for 10mL of one disc is 5.0mL.
To calculate the uncertainty in the average calculations, first you calculate the mean which we already found for 10 seconds which is 5.0 mL. Then you find the difference between the mean and the volumes recorded. Then one must square all the differences you just found. Then you divide that answer with the number of sets of data you have subtracted by one. Then you square root that answer to obtain the standard deviation.
4.6-5.0=-0.4, 5.9-5.0=0.9, 6.8-5.0=1.8, 3.8-5.0=-1.2, 4.0-5.0=-1.0
0.4²+0.9²+1.8²+ (-1.2)²+ (-1.0)²
=6.65/5-1
=1.6625
=√1.6625
=1.3
The change is calculated by subtracting the average volumes.
For example the change in volume produced for 10 s is 5.0 since 10 seconds is the time in which the volumes were recorded; so 5.0-0=5.0mL.
To calculate the uncertainty in the calculation for the change in volume I subtracted the uncertainties obtained from the calculations for the averages for each volume.
Sample calculation for one disc:
1.3-0= 1.3mL It’s subtracted by zero since there is no prior calculation made before 10 seconds. So the uncertainty for the change of average volume is 1.3mL.
To calculate the rate which oxygen gas is produced the change in average volume produced must be divided by ten.
For example the change in 10 seconds of one disc is 5.0mL.
So the rate would be 5/10=0.5mL/s
The table shows the average, change, and rate of average volume of oxygen gas produced per ten seconds of one disc
The table shows the average, change, and rate of average volume of oxygen gas produced per ten seconds of three discs
The table shows the average, change, and rate of average volume of oxygen gas produced per ten seconds of five discs
There is no uncertainty for the rate calculations because it is not a required calculation for this course.
Conclusion
The graph demonstrates that as more time passes the rate of oxygen gas produced decreases. For one and three discs this pattern occurs at a steadier rate since the slope doesn’t experience any significant increases. For disc five the trend line is more steep which is why it has a larger base, 3.4. This steep slope may have been caused by the increase in catalase concentration which increased the rate of oxygen gas produced in the beginning but not enough to continue the increase. The trend line for five discs has a larger r² value because the increase follows a more linear pattern while for one disc and three discs the rate of reaction is slowly decreased; and a power trend line is more of a curve then a linear pattern. The enzyme use is decreased overtime in the reaction so rate of reaction is decreased and there is more struggle for active sites (http://www.s-cool.co.uk/a-level/biology/biological-molecules-and-enzymes/revise-it/enzymes). The first average rates for all discs are significantly higher than the other averages because, the beginning is where the substrate is able to obtain the largest amount of enzymes. In the processed data table, the change in average rate decreases over time because the enzymes no longer have an effect on the rate of catalase activity. There is also a significant increase in the average volume of oxygen gas produced when comparing the number of discs. This shows that when an enzyme is first added to the reaction it causes a large increase on the rate of catalase activity. Therefore my hypothesis is supported by my data results because the data shows the increase in rate of catalase activity caused by the increase in enzyme concentration; and the rate of catalase slowly decreases since there are more enzymes then substrates available.
This lab was limited because of the various different amounts of liver which were on the filter paper discs, this would affect the volume of oxygen gas produced because it would cause there to be more or less liver. When comparing some of the volumes of oxygen gas produced there is a large difference in the volumes recorded which could have been affected by the difference in temperature
To prevent the uncertainty in the amount of liver on the paper discs the person who executing the experiment could be more methodical in their actions. For example they could put the paper discs in the beaker of liver for fifteen seconds and do the same for all the paper discs. Then they could decide to wipe the sides of filter paper twice to get rid of excess liver. By doing this there is less uncertainty in the difference of amount of liver on the filter paper. In addition, a thermometer could be first put into the water in the trough before doing the experiment to reduce the effect temperature on the rate of reaction. This is especially important since temperatures can cause a reaction to occur quicker since there is more energy in particles which causes them to move faster (http://edquestscience.com/pdf/PS-TE-2notes.pdf).
Works Cited
Kosinski, Robert. “A Literature Review on Reaction Time.Clemson University.Sept 2012. Web.19 Oct 2012
“Enzymes.” S-cool.co.uk. 2011.Web. 19 Oct 2012.
“Heat affects matter.” Edquestscience. N.d. 19 Oct 2012