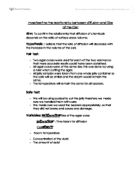
Table 1 shows the percentage error for each estimated population size. Each estimate was obtained using different sample sizes in the recapture: 10, 15, 20, 25 and 30 individuals. Four trials were considered. The results in the table suggest a trend of a negative correlation between percentage error and sample size. Although percentage error does not necessarily decrease with each successive round, there is an overall decrease from round one to found five in all four trials. However, this relation can be depicted more clearly in graphical form. A scatter plot will be used to display the data, since it is discrete. The size of the recapture sample will be represented on the x-axis and percentage error in the population size estimate (which was calculated using the recapture sample) will be represented on the y-axis.
Figure 1: Relationship between recapture sample size and percentage error in population estimate
The negative correlation first inferred from table 1 is far more evident in the curves of best fit for the data. The curves of best fit for all four trials have a similar shape; initially the percentage error is high, but as sample size increases the error decreases. However, the data for each trial does not clearly follow the curve of best fit, which raises doubt on the accuracy of the trend suggested by the curve of best fit. Though to determine a curve that is more representative of a general trend, an average percentage error in population estimate for each sample size (for all four trials) must be taken.
Sample calculation for average percentage error in population estimate for sample size of 10:
Table 2: Average percentage error in population estimate (all four trials):
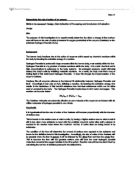
The averaged values in table 2 take into account all three trials and now can be graphed as a single set of points on a scatter plot.
Figure 2: Average relationship between sample size and percentage error in population estimate
The curve of best fit for the average data is similar in shape to the curves in figure 1. This implies a general trend: as the size of the recapture group increases, the percentage error between the estimated and actual population decreases. Although percentage error does not always decrease with each successive increase in sample size (error actually increased from the change in sample size from 15 to 20), the general correlation is still negative.
Conclusion and Evaluation
The overall trend that was observed in this experiment was that as sample size increased, the percentage error in the estimate in population size (compared to the actual size) decreased. It would be assumed that this negative trend would not continue past the sample size of 30, but rather become more levelled with the x-axis (i.e. percentage error remains near zero). Therefore it is more accurate to conclude that as sample size increases, the percentage error of the population estimate approaches zero. These results disprove the proposition made in the hypothesis. The failure of the null hypothesis is due in part to the fact that it is a statistical hypothesis and does not take into account the scientific likelihood of a scenario occurring.
This conclusion seems reasonable because in most cases, a larger sample size is more representative of a population and therefore the margin of error between an estimate population (obtained from the sample) and the actual population will be less. This is supported by published material such as the website of the survey company Raosoft©, which states “a lower margin of error requires a large sample size”
Although the design of this experiment proved effective in determining a fairly realistic conclusion, there were many limitations that could have affected the results. First of all, only four trials were considered. If more trials were considered, the averaged data would be more accurate and would most likely be more representative of the general trend (in this investigation, the averaged data did not clearly follow the trendline). Other inaccuracies could have occurred because the sample sizes were relatively small. The first sample of 20 individuals in the initial capture (constant for all rounds in the experiment) could have been greater and for the second sample (the recapture sample which varied in each round), a greater number of sample sizes should have been considered to determine how far the trend continues. Lastly, since this experiment was carried out using beans in a container, the shape of the container prevented that sampling from being truly random. The beans on the bottom of the container were covered by many other beans and were rarely chosen in the sampling. To correct this, all the beans could have been laid out on a flat surface, where they would randomly be selected. Although natural human error would still exist, this method would be more representative of a sampling in a terrestrial ecosystem. Therefore, to improve this experiment more trials should be considered, a greater number of samples should be taken and the selection of individuals should take on a flat surface where each individual has an equal chance of being selected.
"Sample Size Calculator." 2004. Raosoft. 1 Nov 2008 <http://www.ezsurvey.com/samplesize.html>.