Elevation at 0.6m:
Figure 4: The graph below shows the distribution of the organism at the elevation of 0.6m
Diagram 4: The picture below is from the elevation of 0.6m with analysis showing California Mussels.
Elevation at 0.3m:
Figure 5: The graph below shows the distribution of the individual at a 0.3m elevation.
Diagram 5: The picture below shows the California Mussels with analysis and scale at a 0.3m elevation.
Densities at Each Elevation:
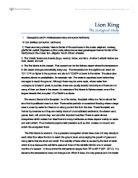
Conclusion and Evaluation:
In conclusion, when the pictures were examined, there was some of whose data could not be collected because of the visibility of the images. The Data of only one specie for the pictures that were visible properly were taken, because the Acorn Barnacle and the California Mussel were never together in one picture. In summary, one could say from the results that Acorn Barnacles are more visible in these elevations shown in seven pictures. This is because Acorn Barnacles is more common than California Mussel as it does not need rocks to cling to. California Mussel are 13-18cm, and can be defined as being bigger than Acorn Barnacles meaning California Mussels take more space. For example, if the density of both were to be collected over the same amount of area, and both covering the same area; California Mussels would be an inferior amount to that of Acorn Barnacles simply because of their sizes.
A limiting factor for this partial lab report was that at points of the particular elevations, species were very hard to identify and distinguish. A specific elevation example would be that of 3.1m above sea level, where species were very hard to find, and when one assumes its location on a particular picture, it would be an error would impact the lab’s results greatly. Three elevations in this lab were not accounted for, them being at 2.9m, 2.3m, and at 0.0m. It was noticed that neither of these had a pattern and were hardly interconnected with each other. Instead, the reason no individuals could be seen was because of the particular location. It was specified that the lab concerned the elevation and its shift for every picture, but it was also because how much it moved horizontally. Another limitation would be the initial Logger Pro software itself and its interpretable methods. Logger Pro is a software usually to analyze videos in a slow pace. Yet, in this age in time it would be a good way of using it for the lab except for the fact that its y-coordinates for each of the elevations’ data is always negative. This would create another problem; when for example two individuals of the same kind were on the same x or y-axis and respectively different for the other, it would have an impact on the graph.
Moreover, numerous improvements could be made for next time in order to make the lab better. When different pictures were taken at different elevations, and as the photos move both vertically and horizontally, it should rather just move vertically so that the same type of species and/or organisms can be examined. Better software can be used to analyze data such as this in order to make the results better and more understandable. In order to obtain better results, or maybe do a more in-depth research, more transects could be analyzed.