Ecological studies of rice (Oryzae Sativa) populations
Practical 13: Ecological studies of rice (Oryzae Sativa) populations
Hypothesis
There is a significant difference in the lengths of the rice in the two different populations of Oryzae Sativa.
Raw and Processed Data
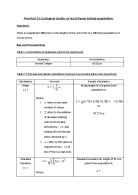
Table 1: Uncertainties of apparatus used in the experiment.
Table 2: Formulae and sample calculations involved in processing data in the experiment.

Table 3: Visual characteristics of the two populations of rice used in experiment.
Table 4: Lengths/cm (±0.01cm) of 30 randomly selected rice grains from two different populations of Oryzae Sativa, mean length/cm (±0.01cm) and standard deviation in lengths.
Graph 1: Mean Length/cm (±0.01cm) of 30 randomly selected rice grains from two different populations of Oryzae Sativa.
Discussion of Results and Conclusion
It can be seen from table 4 that the mean length of a rice grain from population A is 0.757cm, much higher than 0.556cm, the mean length of a rice grain from population B. ...
This is a preview of the whole essay
Table 3: Visual characteristics of the two populations of rice used in experiment.
Table 4: Lengths/cm (±0.01cm) of 30 randomly selected rice grains from two different populations of Oryzae Sativa, mean length/cm (±0.01cm) and standard deviation in lengths.
Graph 1: Mean Length/cm (±0.01cm) of 30 randomly selected rice grains from two different populations of Oryzae Sativa.
Discussion of Results and Conclusion
It can be seen from table 4 that the mean length of a rice grain from population A is 0.757cm, much higher than 0.556cm, the mean length of a rice grain from population B. Graph 1 gives a visual representation of this data. We can also see from Graph 1 that there error bars are relatively small compared to the lengths of the rice and also do not overlap, allowing us to conclude that the values are accurate and have a significant difference between them.
A t-test can also be used to find out whether the lengths of the rice grains from the two different populations are significantly different. The t value for the data is 18.1, which is considerably higher than that of the critical value of 2.001 given in the probability table for 58 degrees of freedom at a significance level of 95%. This means that there is a significant difference between the two data sets from the two populations; i.e. there is a significant difference in the lengths of the rice grains from the two populations. Hence, we can reject the null hypothesis; that there is no significant difference between the lengths of rice grains from the two populations. We can also conclude that the aforementioned hypothesis is true.
The significant difference in the mean length of a rice grain from population A and B is due to polygenic inheritance. It is also the cause of the natural variation in length of the rice grains within the same population. Inheritance of quantitative traits or polygenic inheritance refers to the inheritance of a characteristic that varies in degree and can be attributed to the interactions between two or more and their environment.
The polygenic model makes the following 6 assumptions;
- Each contributing gene has small and relatively equal effects.
- The effects of each allele are additive.
- There is no dominance; instead the genes at each locus behave as if they follow incomplete dominance.
- There is no epistasis or interaction among the different loci contributing to the value of the trait.
- There is no linkage involved.
- The value of the trait depends solely on genetics; environmental influences can be ignored.
Therefore, due to the presence of multiple genes, there are no fixed phenotypes for grain length for each population, instead a range of phenotypes, or continuous variation due to the additive effects of multiple genes.
Another similar example of polygenic inheritance is that of height. Height is not fixed; not everyone is either short or tall, rather there is a range of heights from short to tall. Height is not only affected by genes but also by the environment as is assumed by the polygenic model. A person with expressed genes of tall height may be hindered by illnesses or injuries, causing the person to stay short. Also, a person with expressed genes of short height could grow tall through genetic therapy or other unnatural methods.
Evaluation
Table 5: Limitations and Improvements to procedure.
Bibliography
Decelles, P. (15 June, 2002). Quantitative Genetics. Retrieved 25 July, 2012, from The Virtually Biology Course: http://staff.jccc.net/pdecell/vbscourse.html
Reference.com. (19 September, 2008). quantitative-trait. Retrieved 25 July, 2012, from Reference.com: http://www.reference.com/browse/quantitative-trait
Smith, S. E. (24 July, 2012). What is a Polygenic Inheritance. Retrieved 25 July, 2012, from wiseGEEK: http://www.wisegeek.com/what-is-a-polygenic-inheritance.htm
Screenshot of calculations using Microsoft Excel 2007
(Reference.com, 2008)
(Decelles, 2002)
(Smith, 2012)