Image 2.0 – Image showing where the different groups’ carried out their experiment.
Image 2.3 – Side-view image of 18 Mile Swamp. Image overview of the water vegetation at 18 Mile Swamp.
Image 2.4 – A front and close-up view of 18 Mile Swamp. Various types of water vegetation is also presented by this image, such as reeds, rushes, blue water lilies and bladderworts. Also this image shows the specific experiment site of Group 1.
Table 2.0 – Biotic Survey: This table lists types of organisms found at Brown Lake and 18 Mile Swamp. This table includes the organisms’ common name and their scientific order; the organisms’ pollution sensitivity number towards its environment.
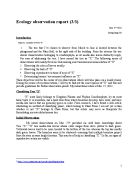
III. Processing & Presenting Raw Data
Calculating the mean
∑ = sum of all the values
N = number of values
x̄ = the mean
Calculating standard deviation
Ơ = standard deviation
∑ = sum of
x = each score
x̄ = the mean
n = number of values
Table 3.0 – Processing all groups’ data: This table shows the mean and standard deviation of all the groups’ data on Brown Lake. This table includes the mean and standard deviation for turbidity; oxygen levels; pH levels; nitrates and temperature.
Table 3.1 – Processing all groups’ data: This table shows the mean and standard deviation of all the groups’ data on 18 Mile Swamp. This table includes the mean and standard deviation for turbidity; oxygen levels; pH levels; nitrates and temperature.
Significant Test
Two-tailed significance – Probability (P)
Perform test at the 5% level (0.05)
H0 : p = 0 (there is no correlation between the specific abiotic factors)
H1 : p > 0 (there is a significant correlation between the specific abiotic factors)
Table 3.2 – This table presents information relating to both data collected from Brown Lake and 18 Mile Swamp. Information such as the t-value, standard deviation and degrees of freedom of both data is shown in this table. This table also compares the abiotic features of both sites and determining if the t-value accepts of rejects the Null Hypothesis.
Note: See Appendix for Critical Values table
Table 4.0 – Calculating Site Health: This table shows calculation of the sensitivity score of Brown lake and 18 Mile Swamp. This table includes the Taxa richness (x) which is the sum of all the ticks made on the biotic survey and the Sensitivity Score (s) which is the sum of the sensitivity numbers divided by the number of taxa groups for each site.
Table 4.1 – Calculating Site Health: This table uses the sensitivity score to explain how to rate the sensitivity score of the site either the score being Poor, Moderate or Good.
Note:
- Good – Many taxa (high diversity), sensitive taxa present.
- Moderate – Medium numbers of taxa (moderate diversity), some sensitive taxa present.
- Poor – Few taxa (low diversity), sensitive taxa present, tolerant taxa predominant.
Brown Lake = Moderate
18 Mile Swamp = Good
Graph 1.0 – This graph compares the average of all groups’ level of turbidity of Brown Lake and 18 Mile Swamp. The error bar is also shown on the data columns. This graph also shows the units turbidity is measured in and the uncertainty.
Graph 1.1 – This graph compares the average of all groups’ oxygen level of Brown Lake and 18 Mile Swamp. The error bar is also shown on the data columns. This graph also shows the units oxygen is measured in and the uncertainty.
Graph 1.2 – This graph compares the average of all groups’ pH level of Brown Lake and 18 Mile Swamp. The error bar is also shown on the data columns. The graph also shows the uncertainty in the measurement of pH.
Graph 1.3 – This graph compares the average of all groups’ nitrates level of Brown Lake and 18 Mile Swamp. The error bar is also shown on the data columns. This graph also shows the units nitrates are measured in and the uncertainty.
Graph 1.4 – This graph compares the average of all groups’ degree of temperature of Brown Lake and 18 Mile Swamp. The error bar is also shown on the data columns. This graph also shows the units temperature is measured in and the uncertainty.
Graph 2.0 – This graph compares the average results of turbidity, oxygen levels, pH levels of Brown Lake of year 2004, 2005 and 2009. The units of measurements is also included on the graph.
Note: See Appendix for history data values
Graph 2.1 – This graph compares the average results of turbidity, oxygen levels, pH levels of 18 Mile Swamp of year 2004, 2005 and 2009. The units of measurements is also included on the graph.
Note: See Appendix for history data values
Graph 2.2 – This graph compares the average sensitivty score of Brown Lake and 18 Mile Swamp in year 2004, 2005 and 2009.
Note: See Appendix for history data values
Graph 2.3 – Graph comparing the number of sensitive, tolerant and very tolerant macroinvertebrates found at Brown Lake and 18 Mile Swamp
Note: See Appendix for history data values
IV. Evaluation of Data and Conclusion
When comparing the abiotic features of Brown Lake (BL) and 18 Mile Swamp (18MS), it has been calculated that some abiotic features of BL and 18MS are statistically the same and there is no difference between the two experiment sites. This statistical analysis is shown in Table 3.2, where the t-value, standard deviation and degrees of freedom were calculated to determine is the Null Hypothesis is accepted or rejected. In this experiment the significance level is set at 5% or 0.05. In Tabel 3.2, the abiotic features that accepted the Null Hypothesis were the turbidity, nitrates and pH level of the two experiment sites. Other abiotic features that were also calculated in Table 3.2 were oxygen levels and temperature. However for these two features, the Null Hypothesis was rejected in favour of the hypothesis which was that the geographic location does affect the abiotic factors BL and 18MS.
Calculations of the health of the experiment sites were also determined by carrying out a biotic survey in Table 2.0. Each organism in Table 2.0 was categorised into being sensitive, tolerant or very tolerant to water pollution. These organisms are known as bioindicators. Linking to Table 2.0 is Graph 2.3, which clearly compares the number of organisms between BL and 18MS. From analysing Graph 2.3 it can be said that that BL is more polluted than 18MS for it comprises of more tolerant and very tolerant organisms where as 18MS comprises of more sensitive organisms. Furthermore, analysis in Table 4.0 verifies that 18MS is less polluted than BL. Table 4.0 shows the sensitivity score for each site – BL has a score of 4.38 and 18MS has a score of 4.70. These scores were evaluated using Table 4.1 which states that BL is moderately healthy and has some sensitive and medium number of taxa (moderate diversity). On the other hand, 18MS has a high diversity of organism and sensitive taxa are present. From these findings, the hypothesis is again accepted for it confirms that the geographic location does affect the biotic factors of BL and 18MS.
Graph 1.0 compares the average of turbidity of BL and 18MS. The average level of turbidity was calculated using all four groups’ data. Turbidity is a term to describe how clear the water is. The clearness of the water depends on the amount of total suspended solids, also known as TTS. The greater the amount of TTS, the murkier the water is thus causing the level of turbidity to be high. [1] Graph 1.0 shows that 18MS’s turbidity level is much higher than BL. More specifically the mean turbidity level of BL is 5.50 NTU (Table 3.0) whereas 18MS is a significant, 14.5 NTU (Table 3.1). The spread of data (standard deviation) of BL shown in Graph 1.0 is less than 18MS. BL turbidity values ranged from 2.00-8.00 (Table 1.2) and 18MS values ranged from 3.00-30.00 (Table 1.3). 18 Mile Swamp turbidity level is much higher than that of Brown Lake for the 18MS has more organic detritus. More organic detritus was also recorded in Table 1.4 – “a lot of moss”. Another reason for the high level of turbidity in 18MS is the lack of activity carried out at this site therefore there is an increase in erosion and nutrient are able to be suspended in the water. With increase number of organic matter and nutrients in the swamp this will affect algae growth. All of these types of vegetation may be the cause of 18MS colour being dark brown and the presence of moss (Table 1.4). Though the data values of Brown Lake and 18 Mile Swamp is clearly different when graphed, statistically there is no difference the turbidity level of BL and 18MS thus accepting the Null Hypothesis.
Graph 1.1 compares the average level of oxygen of Brown Lake and 18 Mile Swamp. Oxygen levels are at a low concentration at lakes and swamps – low enough to still sustain aquatic life. Oxygen levels are also known as dissolved oxygen. [1] Graph 1.1 shows that the oxygen level of Brown Lake is higher than 18 Mile Swamp – BL oxygen level being 7.13 mg/l (Table 3.0) and 18MS oxygen level being 4.56 mg/l (Table 3.0). Air and inflowing streams are all sources of oxygen. So a reason why BL oxygen level is higher is because BL is an open lake where wind is able to stir the water whereas 18MS was full with tall reeds and rushes. The tall reeds and rushed in 18MS prevented the flow of water and because 18MS was below surface level, wind was unable to freely stir the swamp and producing more dissolved oxygen. Another physical factor that affects dissolved oxygen is the temperature and gas saturation of the site. Oxygen is a type of gas and in more of any type of gas can be held in cold water than warm water. The warmer the water is, the less dissolved oxygen is present. Graph 1.4 shows little difference between the temperature of BL and 18MS. Linking back to statistical analysis in Table 3.2, the Null Hypothesis for oxygen level is rejected in favour of the Hypothesis, meaning, there is a difference in oxygen level between BL and 18MS.
Graph 1.2 compares the pH level of BL and 18MS. pH measures the acidity of water. The pH scale ranges from 0-14, 7 being neutral. Water that has a pH level under 7 is said to be acidic and if high than 7, then the water is classified at basic. [1] The near to neutral the pH is, the more aquatic life is present in the site. 18MS has a pH nearer to 7 than BL which means that more organisms are present at the site. This is confirmed by the sensitivity score in Table 4.0 which shows that 18MS has a higher sensitivity score and that the health of the site is better than BL. The standard deviation of both data (BL and 18MS) is very small. In fact the data for pH has the lowest standard deviation (Table 3.2) value, which means the two data values has a very small overlap with each other. The t-value of the two data does not exceed the 5% confidence factor. Consequently, the null hypothesis for the pH value of BL and 18MS is accepted.
Graph 1.4, compares the average temperature of Brown Lake and 18 Mile Swamp. As mentioned above, the different in temperature of both sites is minor – difference is 2.6°C. Temperature changes in lakes and swamps are caused by seasonal air temperature. Furthermore, daily variations in water temperature also occur – the surface of water can be very warm. In the day, the sun warms is the surface of the water and the bottom of the site remains cool. [1] The temperature of 18MS is lower than BL possibly due to the swamp being under land level and the tall reeds and rushes which are blocking off the sun, keeping the water surface cool. In addition, statistics show that there is a significant difference between the temperature of BL and 18MS hence the Null Hypothesis for temperature is rejected in favour of the hypothesis.
Graph 1.3 compares the average nitrates level of Brown Lake and 18 Mile Swamp Nitrates is formed from the oxidation of organic wastes. Nitrate is a form of nitrogen that occurs on the surface of water. Nitrates level tends to be high with waters that have a sufficient and normal level of dissolved water. [2] A high level of oxygen shown in Graph 1.1 justifies the high level of nitrate shown in Graph 1.3. Nitrate is an essential nutrient for plants hence if lakes possess a high level of nitrates, excessive growth of plants and algae will occur. Graph 1.3 shows the nitrates level at BL is higher than 18MS. This level of nitrate can also explain the higher number of species found at BL (Table 4.0). The t-value for nitrates is 0.531 and when calculating this value, it accepts the Null Hypothesis (Table 3.2).
Graph 2.0 compares the average result of turbidity, oxygen levels, pH levels in 2004, 2005 and 2009 of Brown Lake. The graph shows a clear decrease in turbidity over the years. This may be due to the lack of vegetations surrounding the site. Lack of vegetation means less organic detritus. Less vegetation can also be a cause of increase temperature over the years which have affected plant growth. Graph 2.0 also shows immense increase of temperature over the years. In year 2009 the temperature significantly increased compared to the previous years. This is definitely a cause of global warming. Oxygen levels and pH level has stayed quite stable. The pH level of Brown Lake has been acidic for all the years. Oxygen levels decreased in 2009, this may be another cause of temperature, for the warmer the water the less oxygen that is absorbed.
Graph 2.1 compares the average result of turbidity, oxygen levels, pH levels in 2004, 2005 and 2009 of 18 Mile Swamp. Unlike BL, the turbidity of 18MS has increased over the years. The increase of turbidity may be the result of increase algae and reeds. Like the Graph 2.0, the oxygen level is quite stable along with temperature. Again the temperature values may be due to the high reeds and rushes preventing the water being warmed up for the sun. Like Brown Lake, the pH level has all stayed below the neutral value hence the water is acidic.
The standard deviation on the graphs presented in this investigation show that there is a wide range of values in relation to the mean value. In table 1.0, the error bar (standard deviation) shows that the range of data is vast in relation to the mean of the data. The standard deviation bar in Graph 1.1 also shows the range of data varies immensely for 18 Mile Swamp. However for Brown Lake, the error bar is minor thus the range of numbers is close to the mean value. Graph 1.2 shows that both data collected from Brown Lake and 18 Mile Swamp is in a close range to the mean value. In Graph 1.3, shockingly, the data of 18 Mile Swamp were all the same hence the standard deviation value was nil. However for Brown Lake, the graph shows that the data varied noticeably in relation to the mean value. The standard deviation in Graph 1.4 was somewhat precise. For Brown Lake the spread of data did not vary that much in relation to the mean and also for 18 Mile Swamp the range of values varied only a bit in relation to the mean value.
From using the ration of 3:2 – accepted : rejected null hypothesis, statistics show there is a slight difference between the oxygen levels and temperature of Brown Lake and 18 Mile Swamp. There were two abiotic factors that rejected the Null Hypothesis and three factors which were turbidity, pH level and nitrates that accepted the Null Hypothesis. There is a scientific correlation between temperature and oxygen levels – the warmer the water the less oxygen absorbed by the water. The organisms found at each site were also different, therefore it can be concluded that the geographic location does affect the biotic and abiotic factors of Brown Lake and 18 Mile Swamp.
From analysis the graph and using the standard deviation values, it can be concluded that the data collected at both experiment sites varied immensely. Each group’s data varied from one another, and the gap between the lowest value and the highest value is big.
In this investigation many results of abiotic features were not processed and calculated. The two results that were neither processed nor graphed was the salinity and nitrites. This is because there was insufficient data to carry out, t-values and standard deviation.
Throughout this investigation many errors may have affected this result. The following part in this report states the weaknesses and limitations of this investigation.
V. Evaluation Procedure
Appendix
History data on the sensitivity score of Brown Lake and 18 Mile Swamp
Brown Lake Physical Parameters History Data
18 Mile Swamp Physical Parameters History Data
Table for Critical Values for T