4. Placed the test tube in a test tube rack.
5. Measured 1 mL of 3% H2O2 and added it to the test tube.
6. Connected the plastic tubing to a rubber stopper.
7. Placed the rubber stopper in the test tube.
8. Observed for 30 seconds, collected data, and recorded it in the data table.
9. Cleaned and dried the test tube and placed it back in the test tube rack.
10. Massed 2g of finely chopped potato tissue.
11. Measured 1 mL of 3% H2O2 and added it to the test tube.
12. Placed potato on the side of the test tube so that it was not touching the H2O2.
13. Placed the rubber stopper in the test tube and tilted the test tube to allow the potato to fall into the H2O2.
14. Observed for 30 seconds, collected data, and recorded it in the data table.
15. Cleaned and dried the test tube and placed it back in the test tube rack.
16. Massed 2g of liver tissue.
17. Measured 1 mL of 3% H2O2 and added it to the test tube.
18. Placed liver on the side of the test tube so that it was not touching the
H2O2.
19. Placed the rubber stopper in the test tube and tilted the test tube to allow the liver to fall into the H2O2.
20. Observed for 30 seconds, collected data, and recorded it in the data table.
21. Cleaned and dried the test tube and placed it back in the test tube rack.
22. Repeated steps 10-21 two times in order to obtain results for a total of three trials.
3. Method: Controlling Variables:
To control my variables, I will clean and dry each test tube between each test. I will also reset the computer interface to the correct settings before each test begins. To control the amount of H2O2, I will use a graduated cylinder to measure 1 mL of H2O2 for each test. I will keep the amount of tissue (liver and potato) constant throughout each trial by measuring each sample on a scale.
4. Method: Sufficient and Relevant Data Collection:
This method will enable an adequate data collection to address the research question. First, the controlled variables will allow for accurate data with minimal errors. Additionally, the method requires the use of technology, which will ensure accurate data, with less chance of human error. Lastly, this method allows for multiple trials to be run which helps qualify the quantitative data and ensure accuracy.
II. Data Collection and Processing
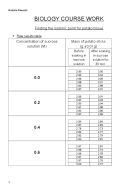
- Raw Data:
B. Data Processing:
1. Overview: The data in the data chart will be corresponded to in a graph that will display the different rates of change for each tissue for each trial. To show the average rate of change, I will calculate the averages of the rate of change for each tissue and graph them along with the raw data.
2. Sample Calculation:
Average Rate of Change for Liver:
(0.19 + 0.24 + 0.19) ÷ 3 = 0.21
C. Presentation of Processed Data:
III. Conclusion & Evaluation:
A. Conclusion:
The results of the experiment indeed support the hypothesis that if liver and potato tissue are tested for the amount of catalase and peroxidase, then it will show that liver tissue has more catalase than potato tissue has peroxidase. The data shown in the above data tables and graphs reveal that the liver tissue converted the H2O2to oxygen and water more quickly than potato tissue, concluding that liver has more catalase than potato has peroxidase. This was shown in the faster rates of change of the liver tissue found in the chart “Rates of Change in Gas Pressure (kPa/sec)”. The results of the experiment can be explained scientific reasons.
- Evaluation of Procedure:
The procedure was effective in obtaining the desired results. The method I used allowed me to effectively control the controlled variables, which resulted in more accurate results. The use of technology reduced the chance for natural human error that may occur during an experiment. The Vernier System was able to accurately gather data, measure the varying gas pressures, and calculate the slope of each trial. Yet, one limitation was the surface area of each tissue. I was able to chop the potato into smaller pieces to increase the surface area that reacted with the H2O2. Nevertheless, the texture of the liver tissue prevented me from cutting it into smaller pieces. Additionally, the size of the potato pieces that were created when I cut up the 2 grams was an added variable that I did not account for. Even though I cut the potato for each trial, the size of the resulting pieces varied between trials, changing the surface area which could have an effect on the accuracy of the data.
- Improving the Investigation:
The accuracy of the data is limited due to the texture and shape of the liver and potato tissue. The liver was randomly shaped while the potato was chopped up into smaller pieces. This changed the quantity of surface area available for the reaction with the H2O2. This inaccuracy could be eliminated by blending the tissues to achieve the same consistency. This would ensure that the surface areas of each tissue of each trial will be constant. It will make the surface area of the tissues a controlled variable, guaranteeing more accurate data. Additionally, more trials could be run with varying amounts of each tissue to give a greater variety of data to further support the conclusions and hypothesis.