5. The test tube is placed in the dark part of the lab for at least half an hour.
6. The cuvet is put into and examined by using a calorimeter.
7. The data are recorded.
DATA COLLECTION
Quantitative Data (Room temperature is 27°C)
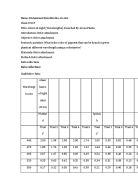
Table 4: The table above shows the amount of absorption of wavelength by the spinach sample exposed to different wavelength, referred to standard solution and taken in 3 different trials.
Table 5: The table above shows the amount of absorption of wavelength by the mustard sample exposed to different wavelength, referred to standard solution and taken in 3 different trials.
Qualitative Data
Table 6: The table above shows the observations during the experiment.
DATA PROCESSING
Quantitative Data
The average percentage of absorbance of wavelength (nm) for the spinach samples exposed in different wavelengths (With respect to standard solution at 0.00nm) in different trials is calculated by using the following formula below:
Where,
T1: Percentage of Absorbance in trial 1 (nm)
T2: Percentage of Absorbance in trial 2 (nm)
T3:Percentage of Absorbance in trial 3 (nm)
N= Number of trials
E.g: The calculation of the average percentage of absorbance of wavelength (nm) for the spinach sample exposed at 440 nm (With respect to standard solution at 0.00nm) in different trials is given below:
= [2.00+2.00+2.00]/3
= 2.00
Hence,
Table 6: Average percentage of absorption by spinach sample (%)
E.g: The calculation of the average percentage of absorbance of wavelength (nm) for the mustard sample exposed at 440nm (With respect to standard solution at 0.00nm) in different trials is given below
= [2.00+2.00+2.00]/3
= 2.00
Hence,
Table 7: Average percentage of absorption by spinach sample (%)
Standard Deviation for the average percentage of absorbance of wavelengths by both mustard sample and spinach sample (With respect to standard solution at 0.00
The calculation for the standard deviation for the average percentage of absorbance of wavelengths by both spinach and mustard samples (With respect to standard solution at 0.00 absorbance) is calculated by using the following formula:
Standard deviation =
Where,
x: Percentage Absorbance of the samples (Spinach or mustard) exposed in different wavelengths
Average percentage of absorbance of wavelengths by samples (Spinach or mustard) (with respect to standard solution at 0.00 absorbance)
N: Number of trial
E.g. The standard deviation for the average percentage of absorbance of wavelengths by spinach sample (With respect to standard solution at 0.00 absorbance) for the wavelength of 440 nm:
= + 0.00 % absorbance
Table 8: The table above shows the standard deviation of the average percentage of absorption of wavelength of spinach
E.g. The standard deviation for the average absorbance of wavelengths by mustard sample (With respect to standard solution at 0.00 absorbance) for the wavelength of 440 nm:
= + 0.00 % absorbance
Hence,
Table 9: The table above shows the standard deviation of the average percentage of absorption of wavelength of mustard.
B) Qualitative Data
Table 10: The table above shows the explanation.
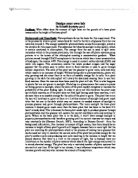
Graph 1: The percentage of absorption against wavelength of spinach sample
Graph 2: The percentage of absorption against wavelength of mustard sample
Graph 1 shows the graph of rate of photosynthesis od disk leaf against distance of the light source from the beaker.
DISCUSSION
a) The photosynthetic pigments are materials that are responsible for absorbing and trapping the light energy in the earlier steps of photosynthesis. One of the major pigments of photosynthetic materials is chlorophylls. Chlorophylls is a mixture of pigments that comprises of chlorophyll a, chlorophyll b and some carotenoids like B-carotene, Xantophyll and phaeophytin. However, other types of chlorophyll like chlorophyll c and bacteriochlorophyll are found in non green plant, protistans and photosyntehetic bacteria.
b) The main objective of this experiment is to prove the fact that different form of plant which contains different concentration/number of photosynthetic pigments is tend to absorb different value of wavelength, hence, its different colour. Earlier hypothesis suggests that the wavelength will be absorbed by the photosynthetic pigment at a different absorption. Different wavelength which is absorbed or reflected by the photosynthetic pigments will determined the colour observed on the leaves. For example, two samples that are used in the experiment is spinach and mustard plant. In the earlier observation, it can be seen that the spinach plant is greener than that of mustard plant which a little bit light green. Hence a hypothesis is formed that the photosynthetic pigments in the spinach plant is able to absorb less amount of green wavelength compared to that of a mustard plant. Hence, more green wavelengths will be reflected by the pigments in spinach plant than that in mustard.
c) The experiment is conducted by having two different plants; spinach and mustard that shows a small difference in their green colors. The plant is dipped into the boiled water first in order to smoothen them up for the grinding process. The boiling water will break the membrane of the cell and cause the chlorophyll easier to be extracted. During the grinding process in the mortar, propanone liquid is added in order to separate the chlorophyll extract from the plant through the process of filtration and is inserted inside a centrifuge tube. The tube later on is inserted into the centrifuge tube and being rotated. The product is a form of chlorophyll extract in partially liquid form. It can be observed that the both supernatant and the debris of the chlorophyll extract are presence inside the tube. The supernatant is inserted inside a test tube and is left in the dark room for 20 minutes. This process is important to prevent the bleaching of chlorophyll.
d) The data collected and observed is processed. Based on graph 1, it can be seen that two peaks is formed. One is near to the wavelength value of 425 nm and another one is near to 650 nm. Another peak is also formed at the through of the graph which is at 540 nm. These two peaks indicate that there is a very high absorption of wavelength. The peak at 425 nm shows absorption of 2.40 % of absorption and another peak at 650 nm shows 1.50 % of absorption. Hence more wavelengths is absorbed than reflected by the photosynthetic pigments of spinach at point 425 nm and 650 nm. However, at the bottom of the graph, it can be deduced there is a low absorption of wavelengths at point of 540 nm which is at 0.75%. Thus more wavelengths are reflected rather than being absorbed at this point.
e) Another separate data is taken with mustard as its sample. Based on graph 2, like spinach, the graph also indicated the presence of two peaks. One is near to 425 nm and another one is around 680 nm. Another peak is formed at the bottom/through of the graph at point of wavelength of 530 nm. These two peaks indicate that the wavelengths at these two points are absorbed most by the photosynthetic materials of mustard. The wavelength of 425 nm is absorbed with a percentage of 2.40% and another peak with wavelength 680 shows percentage absorption of 1.40 %. Hence, more wavelengths is absorbed rather than reflected at these points of wavelengths. However, at the bottom of the graph, it can be deduce that the mustard sample does not really absorb much wavelengths at point 540 nm with an absorption percentage of 1.30%.
f) Graph 3 shows the combination of both percentage of absorption against wavelengths for both samples; spinach and mustard. Based on the diagram, it can be deduced that the peak for the top and bottom of the graphs are nearly the same for both samples. However the point of difference will stand at the percentage of absorption of peak at the bottom of both graphs. For spinach, the minimum point of the percentage of absorption is at 0.75% while the minimum point for the mustard sample is at 1.30%.
g) The first peak indicates the percentage of absorption of wavelengths that produce blue colour. The second peak for both graphs indicates the percentage of absorption of wavelengths that produce red colour. The minimum point of the percentage of absorption for both graphs indicates the absorption of wavelengths that produce green colour. Hence, the absorption of green colour in the chlorophyll pigments in spinach is lower than that of mustard. This means that greener colour is reflected by the spinach compared to mustard. This explains a darker green colour of spinach than mustard.
LIMITATION AND EVALUATION
The table above shows the limitation and suggestion of the experiment
CONCLUSION
Based on the result of the experiment, it can be deduced that the reason on why most plants produced green colors is because the presence of the photosynthetic pigments which absorb certain lights and reflect certain lights. The graph of the percentage of absorption clearly shows that the spinach and mustard absorb both blue and red colour with an exception of green colour. On the graph, it can be proven that the spinach will absorb less green wavelength than spinach; hence it’s greener colour than mustard. The hypothesis is accepted.
APPENDIX
Quantitative Data
The average percentage of absorbance of wavelength (nm) for the spinach samples exposed in different wavelengths (With respect to standard solution at 0.00nm) in different trials is calculated by using the following formula below:
= [2.00+2.00+2.00]/3
= 2.00
Hence,
Table 6: Average percentage of absorption by spinach sample (%)
Table 7: Average percentage of absorption by spinach sample (%)
The calculation for the standard deviation for the average percentage of absorbance of wavelengths by both spinach and mustard samples (With respect to standard solution at 0.00 absorbance) is calculated by using the following formula:
Standard deviation =
Where,
x: Percentage Absorbance of the samples (Spinach or mustard) exposed in different wavelengths
Average percentage of absorbance of wavelengths by samples (Spinach or mustard) (with respect to standard solution at 0.00 absorbance)
N: Number of trial
Table 8: The table above shows the standard deviation of the average percentage of absorption of wavelength of spinach
Table 9: The table above shows the standard deviation of the average percentage of absorption of wavelength of mustard.
REFERENCE
1. Biology Oxford, Standard and Higher Level, Andrew Allot: Topic; Photosynthesis
2. Http://wikipedia_chlorophyll.com
3. Biology for IB Diploma, Hodder Education, CJ Clegg, page 288