Average rise in temperature for Brazil Nuts: 40.3°C
Average rise in temperature for Almonds: 30°C
Average rise in temperature for Walnuts: 31.7°C
Average rise in temperature for Peanuts: 23.7 °C
The definition of a calorie (or kilocalorie) is the quantity of heat energy required to raise the temperature of one kilogram of water by one °C.
The average temperature rise for each food sample group will be used to unsure that the test is as fair as possible. To work out the amount of energy released from each sample of food, a specific formula will be used: Energy Released from Food per Gram (J) = Temperature Rise (°C) x Volume of Water (cm 3) x 4.2 / Mass of food sample (g)
Processing the Data Collected:
Calculating the Calories in the samples:
Brazil Nut:
= 10g x 40.3°C x 4.2/0.2
= 8463 Joules = 2.021 kilocalories
2.021 calories/0.2 g →10.105 kilocalories/g
Almond:
= 10g x 30°C x 4.2/0.2
6216 Joules = 1.48 kilocalories
1.48 calories/0.2g → 7.4 kilocalories/g
Walnut:
= 10g x 31.7°C x 4.2/0.2
6657 J = 1.590 kilocalories
1.590 calories/0.2g → 8.675 calories/g
Peanut:
= 10g x 23.7°C x 4.2
= 4977 J = 1.23 calories
1.23 calories/0.2g → 6.15 calories/g
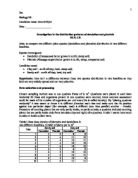
Aspect 3 – Processed Data and Graphs
By analyzing the graph above, we can see that the Brazil nut was the food sample that released the most heat energy once it was combusted. This means it is the most caloric food since it has lots of stored chemical energy. The least caloric food was the Peanut.
By analyzing the results, it is clear that there is a strong positive correlation between the rise in temperature and the amount of calories in the food. Rise in water temperature is directly proportional to caloric value of food.
Conclusion
Since all the foods being analyzed were nuts the results were fairly similar, all ranging from 6 to 10 calories per gram.
The independent variables of the experiment are the food samples. The dependent variable is the energy released by them (Joules and Calories).
Small errors and miscues can result in dramatic variations in results and there are a series of possible sources of error in the experiment, which might have distorted the results, such as:
There is a lag time between the time it takes to fully set fire on the nut and the time it takes to place the burning nut beneath the calorimeter. This might have changed the results since the nut starts releasing energy from the moment it starts combusting. Sometimes the samples were already near to the calorimeter once burned and lag time was short therefore not much heat was lost, whereas other times it might have been far away.
Every so often, the nuts happened to fall from the needle while burning and the fire went out (especially the Brazil Nuts). This is another source of error that might have led to inaccurate results. Once the fire is put out while the nut burns, not all the energy has been used up and transferred to the water in the calorimeter. When this happens, the ending calculation or calories for the sample will be lower than it should.
Some nuts appeared to have been completely burnt when in fact they weren’t. This is another source of error that might have led to inaccurate results. Once the fire is put out while the nut burns, not all the energy has been used up and transferred to the water in the calorimeter. When this happens, the ending calculation or calories for the sample will be lower than it should.
Another regular error occurred since the calorimeter was painted black, a color that absorbs lots of heat, possibly changing the amount of heat released that was used to heat the water. If it were white (a color that reflects heat) more heat energy coming from the stored chemical energy from the nut would have been available to the water in the calorimeter. This would make the results more accurate.
The large sized hole in the calorimeter (acting as a door, used to insert the burning food sample under the test tube with water) made it very easy for heat to escape, making results more inaccurate.
The distance between the burning food sample and the test tube was not measured, it was only estimated. As a result of this, the distance between them changed with every trial, altering the amount of heat transferred from the food to the water.
The temperature rise in water also was imprecise due to the lag time between taking out and putting in the thermometer in the test tube, since it should have been precisely timed, and it wasn’t.
Evaluation:
As mentioned previously, the experiment had a series of errors that affected my results when carried out. This was proven in the analysis and can be evaluated with a basis on the procedures carried out.
A more precise method with specific explanations would have reduced the percentage error for most results. A simple reminder saying: “The distance between the burning food sample and the calorimeter should be exactly 2 inches” might have lowered the percentage error of the results since the distance from which the calorimeter’s water would absorb heat from the food would be the same every trial.
The apparatus provided by The British School of Rio de Janeiro was of good quality. The only changes I would suggest to improve the accuracy of the results are:
- It would be valid to change the color of the calorimeter to white. Black is a color that absorbs heat, while white reflects it. This would be useful since heat might be going to the walls of the calorimeter instead of being passed to the water in the test tube.
- Decrease the size of the opening in the calorimeter so that less heat escapes and more heat is trapped in.
Bibliography: