Materials
- 1 Hula-hoop (90 cm in diameter)
- Ruler
- Meter stick
Method
- Place the quadrat along the line transect specified by the instructor, initially at the base line. Align the quadrat with the flags placed at each corner of the habitat section being studied.
- Count and record the amount of dandelion plants (hubs) present in the quadrat. Make sure each person has taken the job of counting the plants.
- Move in the direction of the fence, and after completing data collection in the quadrat; leave a constant distance of 5 steps between each successive quadrat. This will allow for better representation of the population.
- After reaching the endpoint of one line transect, have the next base line another 5 steps to the left side, and continue counting.
- Continue this pattern of placing quadrats and counting along the 75 meters of fencing and 50 meters of line transect.
Data Collection and Observations
Quantitative Observations
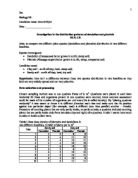
Table 1: The number of dandelions recorded in each quadrat/trial.
Table 2: Averaged data collected from the class
Table 3: Measurements of the quadrat and habitat field
Qualitative Observations:
During the investigation, it was observed that many locations in the transect contained animal excretions, while others did not. The locations with this entity had plants that were smaller than the locations without this entity.
Data Processing and Calculations
Calculations involving individual data: (Using Table 1)
Calculaitons involving class data (Using Table 2):
Table 3: Calculated values for data collected from the class
In order to visualize the trends or patterns in the population of dandelion plants as the investigation progressed, the following graphs were constructed using Excel 2007:
Graph 1: Dandelion plant population (own data)
Graph 2: Average dandelion plant population (class data)
Discussion and Conclusion
As it can be observed from the total dandelion plant population numbers, and from the graphs, there is a trend in the growth pattern of dandelion plants. Graph 1 states that as the number of quadrats increase, the number of dandelion plants also increases with regular fluctuation, and peeks at the last quadrat. This implies that as the quadrats get placed farther away from the portables and closer to the fence, the dandelion population increases, thus proving the hypothesis right. However, Graph 2, for the most part has data decreasing in the direction mentioned, but increasing during the last few quadrats, away from the portables and towards the fence. The “fluctuation of data” may have occurred due to the animal excrements left on the field, which stop the proper growth of plants. Also, human actions, such as walking on the fields and mowing explain the overall trend, especially near portables and the base line. The estimated population from own data, 117900 15068, and class data, 116775 14618 dandelion plants/transect, signify the fairly preciseness of the results of this investigation.
Factors that may have affected the outcome of this investigation may have been the steps taken between each successive quadrat along the transect. This is because when taking steps, some of them were uneven, or did not cover as much ground when walking, which may have resulted in the wrong placement of the quadrat, thus threatening fair representation of the population in the field. Another aspect may have been walking in a straight line towards the fence. Some members deviated from the straight path that they were supposed to follow for best representation of data, which may have caused slight variant results. Also, since this data was shared within the group, the counting of the population by different members may have created the chance of a differing bias, thus keeping the data inconsistent. The counting of the plant can be difficult due to the way the plant grows in the field, overlapping other dandelion plants. This may also have been the reason to the fluctuations shown in Graph 1, not only due to the excrement and student footsteps in various parts of the field.
If this investigation were to be performed again, the steps taken between each successive quadrat should be thoroughly measured with a ruler or tape measure, and then placed, rather than walking 5 steps, which leaves room for huge error. If one wants better representation of data, this is mandatory. When moving towards the fence and away from the base line, one should either look straight ahead and walk in order to stay in the same line transect. Alternatively, the fields could have been marked with lines representing the transects and even the positions of the quadrats, which would have drastically boosted the accuracy and precision of the investigation. Also, if the data is to be shared within the group, then in order to stay consistent, there should be one counter for all the quadrats, removing any discrepancies. These are various ways that the data collection method proves to be very weak and inconsistent.