1 http://www.dakotayeast.com/help-fermentation.html
Ethanol fermentation
“ (performed by and some types of ) breaks the pyruvate down into ethanol and carbon dioxide. It is important in -making, , and -making. Usually only one of the products is desired; in bread-making, the alcohol is baked out, and, in alcohol production, the carbon dioxide is released into the atmosphere or used for carbonating the beverage. When the ferment has a high concentration of , minute quantities of can be produced.
The below summarizes the fermentation of , whose is C6H12O6. One glucose molecule is converted into two molecules and two molecules:
C6H12O6 → 2 C2H5OH + 2 CO2
C2H5OH is the for .Before fermentation takes place, one molecule is broken down into two molecules. This is known as .” (2)
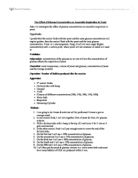
CONTROLLED VARIABLES:
The time each for each fermentation to occur with different glucose concentrations.
The temperature of the water bath.
The mass of yeast used.
The volume of deionized water used in each trial.
DEPENDENT VARIABLES:
the height of the CO2 produced after heating the test tubes for fermentation to occur.
INDEPENDENT VARIABLES:
The %5,%10,%15,20 and %25 glucose concentrations that are used.
MATERIALS
- 100mg yeast
- 4 beakers (100ml)
- 1 beaker(200 ml)
- 1 beaker(500 ml)
- 800 ml deionized water
- 100 ml % 5 glucose solution
- 100 ml % 10 glucose solution
- 100 ml % 15 glucose solution
- 100 ml % 20 glucose solution
- 100 ml % 25 glucose solution
- Ruler
- Thermometer
- Chronometer
- Bunsen burner
- Water bath
2
PROCEDURE:
- In a 200ml beaker, 2,5g of yeast was added to 75ml of deionized water. The solution was mixed completely and set aside.
- Then the solution is seperated and put into 5 test tubes with 15ml in each.
- Then 5 ml of %5 glucose solution is added to each test tubes.
- The top of the test tubes are covered with parafilm so that the CO2 won’t be released after fermentation.
- The initial height of solution in each test tube is measured with a ruler and noted.
- A 500 ml beaker which is filled with 200ml water,is placed on the burner turner and heated to 30 degree Celcius .
- All 5 test tubes are placed inside the 500 ml beaker and heated for 10 minutes.
- In order to keep the temperature around 30 degree Celcius(which is the most propriate temperature for fermentation)water is added to the 500 ml beaker.
- The final height of the gas bubble was recorded at the top of the tube for all 5 test tubes after 10 minutes.
- The carbon dioxide produced by fermentation was determined by subtracting the initial height from the actual height.
- This process was continued for different glucose concentrations like %10,%15,%20 and %25 glucose solutions for 5 times for each.
Table 1:anova table for different concentrations of glucose(%) to determine the whether different glucose concentrations cause difference in rate of fermentation by the p-value.
Hypothesis:Using different concentrations of glucose will give a significant difference in rate of fermentation.
Null Hypothesis:As using different glucose concentrations there will be no significant difference in rate of fermentation.
p-value < α hypothesis is rejected and hypothesis is accepted.
Table 2: The table for the volume of CO2 gas produced for %5,%10,%15,%20 and %25 glucose concentrations and the constant values for temperature,volume of yeast and volume of glucose used.
Examples for Calculations of Statics;
Mean= a+b+c+d+e/5
(1,5+1,3+1,5+1,2+1,3)/5 =1,36
Variance=
a-mean=x b-mean=y c-mean=z d-mean=t e-mean=u Variance=x²+y²+z²+t²+u²/(n-1)
example; 1,5-1,36=0,14 1,5-1,36=0,14 1,3-1,36=-0,06 1,3-1,36=-0,06 1,2-1,36=-0,16 n=5
Variance=(0,14)²+(0,14)²+(0,06)²+(0,06)²+(0,16)²/4=0,018
Standart deviation= =0,1341
Standart error= standart deviation/ = 0,06
Table 3:The mean,standart deviation ,variance and standart error statics for each glucose concentration used.(%5,%10,%15,%20 and %25 glucose concentrations are used)
Graph 1:The mean graph for CO2 gas produced in each different concentration of glucose solution used.
CONCLUSION AND EVALUATION
In this experiment the effect of different glucose concentrations on the rate of fermentation is observed.5 ml of %5,%10,%15,%20 and %25 glucose solutions are added to 15 ml water and 0,500 g yeast by order and heated. The test tubes are covered with parafilm so that the CO2 released by the fermentation won’t be lost. The reason that the test tubes are heated because fermentation best occurs at 30Cº.
By the Anova test it is seen that the p-value 1,01E-16 < 0,05 so the hypothesis is accepted.Which shows that by changing the glucose concentration there will be a significant difference seen in the rate of fermentation .
“The rate of fermentation will increase proportionally as concentration increase but it will eventually stop.”(3)
3http://www.megaessays.com/viewpaper/61901.html