Controlled Variables:
-
Volume of enzyme ( 10cm3 of protease)
The volume of the reagents will be closely controlled to ensure results reflect the effect of temperature, not a fluctuation of the volume of reactants. The volume of the chemicals will be controlled by carefully measuring it out with a measuring cylinder. However as there measuring cylinders could only measure liquids accurate to the first decimal place there will be an uncertainty of + 0.05.
-
Concentration of Protease (5% solution)
The concentration of Protease will be kept constant by using the same stock of Protease for all reactions and by refrigerating it between trials to avoid the denaturation of the enzyme by heat.
-
Time of reaction for each sample (30m)
The amount of time that I allow the enzyme to digest the protein is crucial because enzymes take time to act on proteins and will decide how much of the egg is digested. I will control the time of the reaction by using a stopwatch and weighing the sample as soon as the time is up to ensure accurate measurements.
-
Light intensity
The light intensity under which the reaction is taking place is very important because hydrogen peroxide naturally decomposes under light. I will control this variable by ensuring the light levels are the same when each reaction is taking place.
-
Consistency of chemicals
Though the quality of the chemicals could not be completely guaranteed, I can ensure my results are comparable by using the same stock of chemicals and refrigerating it between trials.
-
Temperature
For the most accurate results, the entire experiment should take place under thermostatic conditions because temperature is a factor in the rate of reaction. I did my experiment at room temperature which is controlled by a thermostat.
-
Surface area
The surface area of egg-white sample. The surface area is maintained to be similar by using a cylindrical bore with a diameter of 0.5 cm to collect the egg white samples.
Uncontrolled Variables:
- The quality of the individual eggs and the quality of the chemicals could not be controlled beyond taking the samples from the same batch from one producer. This should ensure my results are still comparable and therefore the correlation that I derive valid.
- The possibility of contaminants from the used glassware could have been solved by only using new equipment but this was not done because the contaminants are not in significant amount therefore would not affect my results.
Apparatus:
- Water bath
- Test Tubes X20
- Chicken Eggs X5
- Top pan balance
- Bunsen burner (or stove)
- Tripod, wire mesh, heat resistant tile
-
800 cm3 beaker
- Cylindrical bore of 0.5 cm diameter
- Scalpel
- 15 cm ruler with mm scale
- measuring cylinder
-
5% protease at least 200 cm3
Method:
- Set up Bunsen burner with the heat resistant tile under the burner and the tripod and the wire mesh over it.
-
Put the eggs into the 800 cm3 beaker and fill with water until all the eggs are fully submerged.
- Boil the eggs for 10 minutes then peel and remove the yolk after it is cool.
- Using the cylindrical bore, take samples of egg white from the eggs.
- Then use the ruler and scalpel to produce 4 samples of egg white that are 1.5 cm long.
- Note mass of each sample and place into 4 separate test tubes
-
Add 10 cm3 of 5% protease solution to each test tube and immediately put into water bath that is set at the desired temperature.
- Start timer after all 4 test tubes are in the water bath.
- When 30 minutes has been reached, remove all of the test tubes from the water bath and note the mass of each of the samples.
- Repeat process for the different temperatures (including a control experiment with the same process except done at room temperature(step 7)).
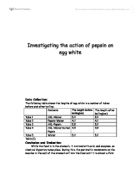
Results:
Calculations:
Mean:
I added up the percentage differences for each set of results (each temperature) and divided by the number of trials (4). For example this is how I arrived at the mean for the first set of data (30 oC):
(9.5 + 8.1 + 8.6 + 7.8)/4 = 8.5
Standard Deviation:
I used this formula to calculate standard deviation for each set of data.
An example of this formula applied to the data is my working for the calculation of the standard deviation of my 30 oC set of data:
(9.5 + 8.1 + 8.6 + 7.8)/4 = 8.5
(9.5 - 8.5)2 = 1.00
(8.1 - 8.5)2 = 0.16
(8.6 - 8.5)2 = 0.01
(7.8 - 8.5)2 = 0.49
1.00 + 0.16 + 0.01 + 0.49 = 1.66
(1.66 / 3)1/2 = 0.74
Percentage Digested Against Temperature Graph:
Conclusion:
From my results, I can see that the percentage of the egg white proteins that are digested by protease increases as the temperature increases starting from 30 degrees and reaches the peak at 37 degrees then the percentage digested rapidly deteriorates as the temperature is further increased. The data roughly fits a parabolic curve of best fit generated by Microsoft Excel. These results suggest that the optimal temperature of use for protease is 37 degrees celcius because it is the most efficient at that temperature (most egg digested in 30m). Also, the results suggest the enzyme begins to denature after reaching 40 degrees since its efficiency is lower than what the line of best fit predicts it to be. These results support my hypothesis of the enzyme being most efficient at 37 degrees and least efficient at 45 degrees.
However I did not test the digestion rates for each degree so chances are that the optimal temperature is not 37 degrees but a temperature 35 and 40. I believe the quality of my results is fairly good from the relatively small error bars.
Evaluation:
Despite the fact that the results I collected in the experiment had fairly small deviation and was in support of my hypothesis as well as the scientific theory behind it, there were a number of systemic and random errors that should be addressed to improve the experiment in the future.
The first systemic error was my inability ensure every egg white sample had the same surface area prior to testing. This error could cause inaccurate results because surface area is a factor in the rate of reaction. This could be remedied by making more accurate measurements possibly by using more sophisticated technologies and ensuring the two flat surfaces of the cylinder of egg white is indeed completely flat.
Second, the degree of dryness of the egg white when it is weighed (after digestion) affects the accuracy of the measurement hence the accuracy of the results. This can be solved by first drying most of the moisture with a paper towel then allowing it to air dry for the same amount of time thus ensuring the measurements are accurate.
Thirdly, the amount of time the egg was digested for varied. This was due to the large sample size it was difficult to start all of the reactions at the same time i.e. to put the egg white into the enzyme solution all at the same time. This however, could be solved by having more help for starting and ending the experiment.
Fourth, the data collected does not clearly show at which specific temperature protease works best under. To get the definitive and more exact optimum temperature, a larger data set will be needed that both increases the number of trials per temperature as well as the number of temperatures tested.
Random errors I have experienced include the quality of the protein in the egg white samples as well as the quality of the enzyme solutions. Both of these random errors may have caused the fluctuations in the results. The quality of the egg white samples could be standardized by scrambling the egg whites of many eggs before cooking hence making all samples consist of the same egg white. The quality of enzyme solution could be controlled by using only one batch of chemical and making sure it is of hi quality.