Samia Murgham 11N
Chemistry Lab: Thermometric Titration
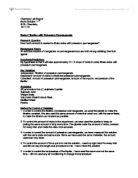
Aim: to determine the concentration of hydrochloric acid by temperature in a titration.
DATA COLLECTION AND PROCESSING
Raw Data Collection:
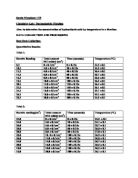
Quantitative Results:
Trial 1:
Trial 2:

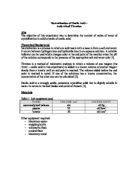
Processed Data:
Uncertainties of the experiment:
Uncertainty of the 25 cm3 pipette is ± 0.1 cm3, and the percentage uncertainty is:
0.1 x 100 = 0.4%
25.0
Percentage uncertainty of the burette since 20 cm3 was used altogether in each trial:
0.1 x 100 = 0.5%
20
Percentage uncertainty of the temperature probe: the temperature rise was 26.8-22.5= 4.3°C. Two readings were taken to measure this and so the uncertainty will be multiplied by 2.
[(0.1 / 4.3) x 100] x 2= 4.7%
Uncertainty of the stopwatch:
(0.5/ 200) x 100 = 0.25%
Total percentage uncertainty:
...This is a preview of the whole essay
Processed Data:
Uncertainties of the experiment:
Uncertainty of the 25 cm3 pipette is ± 0.1 cm3, and the percentage uncertainty is:
0.1 x 100 = 0.4%
25.0
Percentage uncertainty of the burette since 20 cm3 was used altogether in each trial:
0.1 x 100 = 0.5%
20
Percentage uncertainty of the temperature probe: the temperature rise was 26.8-22.5= 4.3°C. Two readings were taken to measure this and so the uncertainty will be multiplied by 2.
[(0.1 / 4.3) x 100] x 2= 4.7%
Uncertainty of the stopwatch:
(0.5/ 200) x 100 = 0.25%
Total percentage uncertainty:
0.25% + 4.7% + 0.5% + 0.4%=5.85%
Graph showing the results of the experiment:
The equation for the neutralization reaction is:
HCl (aq) + NaOH (aq) →NaCl (aq) + H2O (l)
NaOH= (1 x 25)/1000= 0.025 mol of NaOH involved in the reaction
Since the ratio that NaOH reacts with HCl is 1:1 then 0.025 mol HCl is required to neutralize the NaOH.
The highest point (of temperature) on the graph will be the point of neutralization.
CA= CB x VB
VA
CA= concentration of Acid
CB= concentration of base
VB = volume of base (cm3)
VA= volume of base (cm3)
CA = 1.00 x 25.0
6.66 (as obtained from the graph after extrapolation)
= 3.75 M
CONCLUSION AND EVALUATION
The results obtained do not match the standard approximate value of concentration of HCl that was written on the bottle.
Variation of the value obtained for the concentration of the acid as compared to what was written on the bottle:
The concentration value of HCl written on the bottle was 2.0M.
The concentration value obtained from the experiment was 3.75M
The value obtained is 3.75-2.0= 1.75M more than 2.0M
Possible error (uncertainties from the apparatus) was 5.85%.
5.85% of 3.75 M = 1.17M
Therefore the maximum value of concentration that can be obtained after including error from the apparatus only is 3.17M… however an extra 0.58 M remains. This is probably due to other errors in the experiment.
Possible Errors:
- The NaOH or the HCl or both chemicals may have been contaminated.
- The wrong concentration of NaOH may have been written on the bottle as it was made carelessly.
- The HCl concentration of HCl which was used as the ‘standard value’ that results were compared to may have been inaccurate.
- Heat could have been lost to the surroundings from the polystyrene cup.
Improvements that can be made to increase the accuracy of this experiment:
To combat problems in the first 3 bullet points: the concentrations and purity as well as pH of each chemical can be measured before performing the experiment to ensure that they are accurate and do not affect the results obtained.
A calorimeter, a simple device that insulates heat well, can be used instead of a polystyrene cup so that heat loss is prevented. It contains an “insulated jacket” which does not allow any heat to escape or to be absorbed from the surroundings. It also has a stirrer which keeps the heat well and evenly distributed. It has an initiator wire that starts the reaction instead of lighting a wick then moving it under a beaker. The experiment could be repeated more times to improve accuracy by obtaining better averages of many raw data values.