Verifying Boyle’s Law By Looking at the Relationship Between Pressure and Volume of Air Adnan Masood
5/5/2009
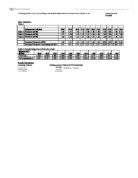
Data Collection:
Table 1

Table 2-Transforming Data to Plot onto Graph
Sample Calculations
Inversing Volume Finding Inverse Volume (1/V) Uncertainty
...
This is a preview of the whole essay
Table 2-Transforming Data to Plot onto Graph
Sample Calculations
Inversing Volume Finding Inverse Volume (1/V) Uncertainty
=
Graph 1-Plotting Volume Against Pressure
- Pressure uncertainties too small to be seen.
Graph 2-Plotting Inverse Volume Against Pressure
- Uncertainty bars of only the first and last points are shown, as that is all that is needed to determine the slope uncertainty.
- Some uncertainty values are too small to be seen.
- The x-uncertainty values were used as they were larger than the y-uncertainty values.
Finding Uncertainty of Slope
X-Value Uncertainty-1st Point=
-2nd Point=
Therefore,
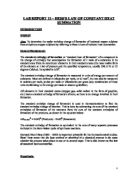
Concluding Statement:
It was found that Boyle’s Law holds true since the slope of graph 2 was a linear relationship. This shows that the pressure of a gas is inversely proportional to its volume.
One of the assumptions made in this lab was that the temperature was considered to remain constant. The variable of temperature was controlled by changing the pressure very slowly so the process would be isothermal. Along with that, once a certain volume was reached, the pressure reading was not taken until after a few seconds so that the temperature could stabilize. But this is not necessarily true. Even though the pressure was being changed slowly, there still would be some changes in temperature, even though if they are extremely small. Because if the pressure changes, that means the particles have more kinetic energy, and if they have more kinetic energy, that means the temperature increases. It was also assumed that the number of mole of gas was a constant, and that none of it leaked out of the syringe. But realistically, there would have been a small amount of molecules that leaked out of the syringe.