La ministra refirió que en la actualidad hay un déficit de viviendas que asciende a 300 mil unidades a nivel nacional, y la demanda de los sectores C, D y E continúa al alza.
Proyectó que en los próximos dos años y medio el déficit se cubrirá fácilmente con un trabajo más coordinado con las empresas.
Economics Coursework:
“Peruvian Construction Sector Grows by 16.5% in 2009”
Article:
by “Peru en Videos”.
Economics topic: Microeconomics Word Count: 750
Extracts Used:
“According to the newspaper “Gestión”, the construction sector of the economy would grow 16.5% this year [2009], a number similar to the growth seen in the year 2008, due to the strong backing the government is giving it amidst an international financial crisis”
“This dynamism in the construction sector will also promote 380 thousand direct workplaces in the year 2009, which will help counteract the effects of the financial turbulence, the minister Vilchez affirmed”
“2700 millions will be assigned to subsidies of social programs concerning housing such as “Techo Propio”. There are also resources to guarantee housing credit.”
“The minister said that the aim of the government is to add about 50,000 housing units to the “Techo Propio” -program, with an interest rate of 10.2% and a minimum starting amount of 3%”
“The minister added that currently there is a deficit of housing that ascends to 300 thousand units at national level, and the demand of the C, D and E sectors continues rising”
Definition Sources:
1. Blink, Jocelyn and Dorton, Ian, “IB Economics Course Companion”, 2007. Pg. 67
2. Tragakes, Ellie, “Economics for the IB Diploma, Standard and Higher Level”, 2009. Pg. 36.
3. Moffatt, Mike, on “economics.about.com” (http://economics.about.com/cs/economicsglossary/g/market.htm)
4. Blink, Jocelyn and Dorton, Ian, “IB Economics Course Companion”, 2007. Pg. 25.
6. Blink, Jocelyn and Dorton, Ian, “IB Economics Course Companion”, 2007, Pg. 10.
7. BusinessDictionary.com, http://www.businessdictionary.com/, accessed 24th of September, 2010
5. Sullivan, Arthur; Steven M. Sheffrin “Economics: Principles in action”, 2003.
Source of diagrams: all Figures (from 1 to 6) are my own work.
The article discussed in this coursework is about the rapid growth in the Peruvian construction sector, caused by the subsidies it receives from the government due to the shortage existing in the market and the high demand, which is still increasing. It will evaluate this government policy, and predict what will happen in the housing market in 2010, by using three possible scenarios.
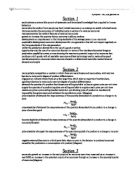
There is a shortage (“deficit”) of housing, which is represented in the demand and supply diagram Figure 1. This shortage, represented by quantitya – quantity0 (qa – q0) has been caused by an increase in demand, from q0 to q1 overtime, and means that quantity demanded – quantity supplied > 0. Eventually, the new market equilibrium, represented by “m1”, will be reached by a movement along the supply and the demand curves, causing the price (“p”) to rise from p0 to p1, thus eliminating the shortage.
The government has subsidy programs such as “Techo Propio”, which allow the construction sector to grow, since there is an increase (a rightward shift) in supply, shown by an arrow in the appropriate demand and supply diagram, Figure 2. below. The subsidy causes a larger quantity (q1 instead of q0) to be supplied, however the difference between the price that suppliers need to receive to produce at that quantity (q1) and the price that consumers are willing to pay for that quantity is represented by ps -p1. Thus, the government pays the equivalent to the dashed triangle in the diagram.
The Figures 3, 4 and 5, represent the three possible scenarios in the Peruvian housing market for the year 2010. As we can see below, in Figure 3 the relative change in supply (“ΔS”) is greater than the relative change in demand (“ΔD”), in Figure 4 both are equal (ΔS = ΔD) and in Figure 5 the relative change in supply is greater than the relative change in demand (ΔS > ΔD). The current price and quantity are shown as price0 and quantity0 (or p0 and q0), whereas the future price and quantity are shown as price1 and quantity1 (p1 and q1). The respective changes, or shifts (e.g. from S0 to S1), in demand and supply are represented by arrows.
Figure 6 is a chart showing what has happened to the price (p) and the quantity demanded (q) in each scenario. Thus, the future quantity demanded seems unpredictable, whereas the price will definitely increase. Out of the three scenarios, the one of Figure 3 is the most likely since the supply is increasing because of the subsidies discussed and because of the massive growth in the industry, which is why its relative change will probably be greater than the relative change in demand. Since the growth is steady (similar growth was seen in 2008, according to the article), the shortage will probably be eliminated in a few years, also because of the government having “resources to guarantee housing credit”.
Yet, this could mean giving access to it to people who otherwise couldn’t have access to it, including consumers who will not have the resources to repay the credit, thus leading to similar consequences as those seen in the financial crisis already. Also, credit generates debt, which risks future economic growth given that indebted households will have less purchase power. The subsidy, on the other hand, might decrease worries about the high prices of housing, as well as stimulate the economy amidst a financial crisis by creating jobs. However, as with any government spending, there is an opportunity cost involved, and the money could have been spent somewhere else, even on tax breaks. On the other hand, stimulating this sector could provide a better infrastructure, which would be beneficial, since it is vital for economic growth.
Subsidy: money amount paid by the government to a firm.
Shortage: more being demanded than supplied at certain price (such as p1 in Figure 1).
Market: place where the sellers of a particular good or service can meet with the buyers and where there is a potential for a transaction to take place.
Demand: quantity of a good or service consumers are willing to purchase at a given price in a given period of time.
. Credit: provision of resources by one party to another where that second party does not reimburse the first immediately (thereby generating a debt)“
Opportunity Cost: the next best alternative forgone when an economic decision is made.
Infrastructure: internal facilities of a country that make business activity possible.