Firstly, diminishing marginal utility results in the curve being downward sloping. Consumers buy goods and services because these provide them with some utility (benefit or satisfaction). The greater the quantity of a good consumed, the greater the utility derived. However, the extra benefit provided by each additional unit increases by smaller and smaller amounts. For example, you buy a chocolate bar (Q1), which provides you with a certain amount of benefit (P5). You are still hungry, so you buy a second chocolate bar (Q2). Whereas you will enjoy this, you will most likely enjoy it less than you had enjoyed the first (P4). If you buy a third (Q3), you will get even less benefit than from the second (P3), and so on with each additional chocolate bar. The extra benefit that you get from each additional unit of something you buy is the marginal utility (marginal meaning extra or additional). Since each successive unit of chocolate you consume (Q1 to Q6) produces less and less utility (from P5 to P0), you will be willing to buy each extra unit only if it has a lower price.
When the price of a normal good decreases relative to that of substitutes, a buyer will substitute the now cheaper commodity for those whose prices have not changed. At the same time, the decreased price of the normal good under discussion will make the buyer wealthier in real terms. More can be bought of this good (as well as of others whose prices have not changed). Thus, the substitution and income effects reinforce each other: More will be bought of a normal (or superior) good as its price decreases. On a graph with price on the vertical axis and quantity on the horizontal, this is shown as a demand curve sloping downward from left to right.
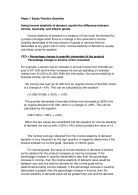
Moreover, the income effect results in the curve being downward sloping. When the price of a product falls (P1 to P2), then people will have an increase in their ‘real income’, which reflects the amount that their incomes will buy. With this increase in real income, the people will be likely to buy more of the product, hence there will be an increase in the quantity demanded (Q1 to Q2). Conversely, an increase in the price of the good reduces consumer’ purchasing power.
In conclusion, according to the law of demand there is a negative causal relationship between price of a normal good and its quantity demanded over a particular time period, ceterius paribus: as a price of a normal good increases, quantity demanded falls; as the price falls, quantity demanded increases, ceterius paribus. There is an inverse relationship between price and quantity. The higher the price of a normal good, the less of it you are able to buy; as the price falls, the good becomes more affordable, and you are likely to want and be able to buy more of it.