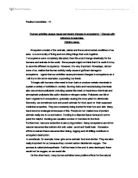
On the trip the Tambopata Lodge we did a transportation investigation in which we recorded the types of boats we saw (fig 3.1).
Figure 3.1 Boat seen on trip to the Tambopata lodge
The main way of transportation between Puerto Maldonado and the inner Rainforest was by boat.
Boat used as transportation in River Tambopata.
Velocity
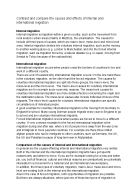
We broke down tree sticks into the same sizes and then we chose a throwing place (see fig 3.3). We did this because we tried with orange skin first but they weren’t as visible as the sticks.
Safely sat on a tree, which went across the river, throwing the sticks
The throwing place had to be in the middle of the river (see figure 3.3) so the friction did not affect the measurement of the maximum velocity
Then we measured 10 metres away from the throwing place, as the amount of flow measured. (Fig. 3.4).
Measuring the 10 metres.
Holding the measuring tape
for making measurement accurate we took rocks as a guiding for the ten meters.
A person was placed with a chronometer at the ten metres spot. We had to time since the exact moment that the stick was placed in the water, and stop when it reached the 10 metres spot (fig. 3.5).
Chronometer
Checking on the 10 meter point
10 meter point
This procedure was repeated 5 more times, so we could get an average. This way we could make the measurement more accurate.
Then we divided the average time by 10 metres for getting the velocity in metres per second as a unit.
The method was done for Sites A and B on the same river, this way we could compare and analyze.
Ph
We took the samples for Sites A to F, then went to the lab and analyze thrice each sample using the pH meter (Fig 3.6) so we could get an average for each.
A ph meter, similar to the one we used
Reading point
Measuring point
Other ways of measuring the pH of samples would have been with a Universal indicator, or titrate the samples by doing an acid base titration, or a pH indicator, but from all the options the best was a pH meter, it was accurate and fast, and could be transported to Tambopata.
Cross Section
We measured the cross section of Sites A and B because they had a tree going across the river and therefore this made it easier to make the measurements. (See fig. 3.7)
Holding the measuring tape
On the other side of the river
Measuring the width.
We measured the width of the river (fig 3.7), for knowing it for the cross section drawing and for getting the cross sectional area.
Measuring Tape
Calling each meter
Measuring the Depth with the measuring stick
Line every 25 cms.
Using a long measuring device with marks every 25 cm. We measured the deepness of the river every meter (fig 3.8) so we could get systematic points and get regular intervals.
After the measurements the drawing of the cross section would represent more accurately the gradual changes in the basin of the river.
Discharge
The discharge of the river is measured after getting the velocity and the cross section data from the two sites in the river. In order to get this measurement we used the following directions:
- Measure the area of the cross sectional area by adding up all the measuring taken and dividing them by the river’s width
- Then Multiply the velocity times the cross sectional
-
This will give the discharge in m/sec3
We get the drainage of both sites so we could compare and relate it with the usage of water by population throughout the river.
Turbidity
Figure 3.9 A secchi disk entering the water
Marked string holding the secchi disk
Measuring lines every 25 cm.
Painted black and waited for increasing the visibility
The turbidity was measured using a Secchi disk because it was easy to use and transportable through the jungle to the different sites. (see fig 3.9)
We used the secchi disk by measuring the cm. the rope gave at the last moment the secchi disk was seen while sinking it, and then measure the cm. given by the rope at the first sight of the secchi disk under the water while pulling it out. (see fig. 3.10)
A sketch of what the collection of the Turbidity Data looked like
Person measuring the turbidity with the secchi disk, the same one for every turbidity measurement.
Tree trunk
Line every 25 cm.
Secchi disk
River
An average of the water turbidity was taken by the sinking measurement and the appearing measurement (see fig 3.10). This was done by adding both measurements and dividing them by two. These calculations where done for each site we measured.
Vegetation
We used 50 x 50 cm. quadrats for this measurement because it was a portable size of quadrant, a bigger quadrant wouldn’t have been able to transport it to Tambopata and also if there were any steep slopes it wouldn’t have given an accurate result.
Figure 3.11 The different ways of sampling
There are different types for sampling; Random, Systematic and Stratified. Systematic and Stratified Areas are sampling measurements were you plan how to do the measurement. Instead Random Sampling is done by measuring random points. In figure 3.11 we see where the different types of samplings are done, how the different samplings are distributed, and if they have a pattern or not.
Random sampling was done for these measurements in order to get a more accurate average of the vegetation in the area (see fig 3.11). We used the same number of areas measured in each level of the river edge for each river site. The quadrats were thrown randomly so we could measure the large amount of species in the edge of the rivers.
After throwing the quadrats the species of vegetation located inside the quadrant were counted. This way we could get an average of the species in each level of the river floodplain. 2 quadrats were thrown for each level (see fig 3.12).
Figure 3.12 A sketch of how I classified the levels of the river’s floodplain
Level 3
10 – 15 metres
Level 2
5 – 10 metres
Level 1
0 – 5 metres
After doing this a gradient of vegetation going through out the 3 levels of the floodplain should be able to be taken (see fig 3.12).
Temperature
To measure the temperature () we went to the different sites with a thermometer and sink it for 5 minutes and then took out the thermometer and see the recording. The measurements were done as in fig 3.13:
Trunk of a tree
Person measuring the temperature
Chronometer
Thermometer
River
Transportation
Table 4.1 Boats seen during trip _
We can see that most boats are local and taxi, and only one cargo boat, therefore we see that there is very little industry in this part of the rainforest.
Velocity
Table 4.2 Measurement of time taken by sticks to get to the 10 metre limit
For getting the velocity I took the average of time taken by the sticks and divide the distance (10 m) by it, I got the values from table 4.2. (see appendix for calculations)
Average Velocity = Distance
Time
With these values we can say that both hypothesis 1 and 2 are accepted because the River flow is faster in site B, consequently, the velocity further away from the mouth of the river and before a meander is faster. This happens due to the structure of the river and its steepness. Rivers flow due to the gravity, therefore, the river should be steeper further away from the mouth for the gravity to work., by being steeper there will be more gravity, hence more velocity of the water (see graph 4.1)
Graph 4.1 Bar chart of velocity in both sides
The Data collected also means that the river does flow faster before the meander due to the friction the meander causes. (See fig 4.1)
Figure 4.1 A meander in Tambopata river sowing the differences in velocities
The inner side of a meander where deposition happens on Tambopata River
Slower water Faster water
Flow Flow
If the water undergoes a meander it touches more one edge of the river, therefore will create more friction. This friction stops slightly the flow of the river.
However it was before the meander (see graph 4.2)
Graph 4.2 Flow graph of velocity on site A and B
The water has the impulse from before with nothing stopping it; therefore will be faster
pH
Results of pH measurement (Table 4.3)
The pH values are shown in table 4.3, where the 3 measurements and the averages are shown.
The values show me that my hypothesis is rejected, because the data collected does not proof that while there is more flow, the water will be more basic, it shows the opposite (see graph 4.3 )
Graph 4.3 Bar chart of pH average measurements
It shows that calmer water flow sites have a higher pH. This means they are more basic.
This is because in the calmer places there is more sediment and other organic materials which make the water’s pH increase. For example in the soil there is ammonia which has a pH 9, this is produced by the bacteria in the soil. Where there is calmer water, the bacteria will be able to work reproduce more and be more efficient. (See graph 4.4).
Graph 4.4 Line graph of pH average measurements
Sites C, D, E, and F are calm water zones
Table 4.4 The Spearman’s correlation table
The Spearman’s correlation table also rejects the hypothesis because it shows how as going to calmer places, the pH increases (see graph 4.5).
Graph 4.5 Scatter graph of average pH along the Quebrada Sachavacayoc river and Tambopata river
An anomaly happen in Site E which has greater pH than Site F (see graph 4.5), this happens because Site E had more calm waters than Site F. Also Tambopata river is not included in the pattern of the correlation, this happens because it is another river, from a different source (see map 1.4).
Cross section
Table 4.5 Results of the measurements of deepness of the river in Sites A and B
Deepest Points in the river
The graphs 7 and 8 done with the table (see table 4.5) shows us that my hypothesis is correct; both Sites show the deepest part in the middle.
Cross Section of Site A _ (Graph 4.6)
River
Bed of River
j
Site A (see graph 4.6) instead is still as the hypothesis says even being after a meander, because the friction done by the curve only erodes the edge of the rivers at the meander After the meander, the water flow’s center of gravity goes back to where it was, in the centre, and keeps eroding the center of the bed.
Cross Section of Site B (Graph 4.7)
River
Bed of River
In site B there is an anomaly due to the formation of a little pool next to the main flow of water between the first meter and the ninth (see graph 4.7), this happens due to the deposition of materials in the ninth meter.
Discharge
Cross Sectional Area= width x mean of deepness’s
Discharge = Velocity x cross sectional area
(See appendix for calculations)
Bubble Graph of the Discharge of Site A and B (Graph 4.8)
The discharge is higher in Site B which is further apart from the Tambopata River.
The Data shown on graph 4.8, tells us that the hypothesis is rejected. This happens because the water is used in the jungle by the tribes and the lodge, specially the lodge which was near to the sites measured. Therefore if the water is taken out by the population near to the river for domestic use and some industries, and also absorbed by the plants there will be less water left in the river; hence less discharge as seen in the data collected. (See graph 4.8)
Turbidity
The data shown in table 6 and graph 4.9: show that the hypothesis is accepted because the higher the number for the site, the less turbidity; therefore the graphs show that the calmer sites have less turbidity than the fastest water flow sites
Table 4.7 Measurements of turbidity on the different sites _
Graph 4.9 Bar chart of all the average turbidity measurements results
This happens because the calm sites are able to sediment all the soil instead the water transports the soil, erodes the particles and carries clay due to the flow, the fastest the flow the smaller and more particles it will carry due to the erosion. As the Hjulström graph shows (see fig. 4.2)
Figure 4.1 The Hjulström graph showing its theory
Graph 4.11 Area chart for the visibility of the secchi disk
Graph 4.10, done with result’s table 4.7, shows the measurements taken when using the secchi disk, I made this graph to show how the first and last seen of the secchi disk should be over the same range. There is an anomaly in site D because the secchi disk was seen until it touched the bottom of the inlet lake, because the water was very shallow.
Vegetation
Results for vegetation weren’t able to collect due to the steepness of the floodplain around the sites of the river, they where very slippery and dangerous due to high gradients and the mud. The steepness is shown on the Topographic map 4.1
Map 4.1 Topographic map of the Floodplain of the Quebrada Sachavacayoc River around the lodge
The map was done with the gradients I saw on the edges of the river. Those gradients have been formed due to the very soft soil under the river, this is easy to erode and wash away, therefore it was washed away by the water so steep gradients where formed.
Temperature
Table 4.8 Results in the measurement of Temperature throughout the Sites A to F and Tambopata River
Graph 4.11 Line Graph of the temperatures in Sites A to F
Graph 4.11 shows that throughout the river there is very little variation, it varies only between the fastest sites and the slower water flow site on the river. The temperature is 0.4 ºC higher in the calmer sites.
This means that the first hypothesis is correct. The hypothesis which says that lakes will have higher temperatures is also correct (see graph 4.11 and table 4.8) the temperature varies in lakes by being 1ºC higher than in the river. This happens because the water is still, therefore, it has more time to absorb the energy and heat up.
Conclusion and evaluation
Aim 1
The hypothesis 1.1 was accepted because site B (shown in map 1.7) had a faster flow than Site A (shown in map 1.7), which means that the flow was faster further apart from the mouth. This follows the pattern because site B is steeper than site A due to its location along the river channel. This follows the long profile characteristics of a river seen in figure 4.1.
The characteristic long profile of a river (fig .4.1)
Aim 2
The hypothesis 2.1 was also accepted because site B was before a meander, instead Site A was after a meander and Site B was faster. This follows the pattern seen in figure 3.2, which shows that the river’s velocity is slower in a meander due to the friction; therefore it will be also slower after a meander.
Aim 3
The hypothesis 3.1 is rejected because Site F (shown in map 1.7) is further apart from the river mouth and it had a higher pH than site A. This means that the pH was more acidic at the end of the river. Therefore a modified hypothesis is that Site A would have a lower pH than Site F because it is nearer to the mouth of the river.
Aim 4
Hypothesis 4.1 was accepted because the deepest zones of the sites examined are in the middle of them, this means neither of them is in a meander. This follows the patterns shown in figure 3.2, which shows also that the deepest zone is in the middle when there is no meander.
Aim 5
The hypothesis 6.1 is rejected because the Site A which is near to the Tambopata River has a lower discharge than Site B which is further away. Therefore a modified hypothesis would be that Site B has a greater discharge because it is located before the usage of water by the populations around this river.
Aim 6
The hypothesis 6.1 is accepted because we can see that the calmer sites analyzed have a less turbidity than the faster sites analyzed. This happens because there is more movement of matter in the faster sites, therefore everything is floating and creating turbidity.
Aim 7
Because the data was not possible to collect, only by sight we can say that the hypothesis is rejected, because the vegetation was everywhere even on the edge of the river. As seen in the figure 3.4 and 3.5.
Aim 8
The temperatures in the faster sites where lower than the ones in the calm sites like the lake or the main river with calmer flow. This means that the hypothesis 8.1 is accepted. This happens because the calmer sites are able to absorb more heat from the sun.
Aim 9
For the same reason (as in aim 8) lake has a higher temperature therefore hypothesis 9.1 is accepted.
Evaluation
The velocity measurements had some errors, for example there where some boulders right under the measuring path in both sites. This created friction and led to reduced velocity measurements.
In Site A (shown in map 1.7), the tree was touching the water which also reduced the velocity. We should have measured the flow right before the tree and the boulders.
The pH measurement’s errors where that the bottles in which we collected the samples may have had some residues left from the drinks they contained. We should have rinsed the bottles more times with water from the river before putting in the samples.
For the cross section we may have had different results from the true ones due to the boulders in the river’s basin. Instead of measuring the basin itself we may have measured the boulders. We should have moved the stones with the measuring device and find the basin and measure it.
The discharge method has the errors from the velocity and cross section measurements, because those are the results we use for the discharge calculation.
The problem with the turbidity measurement is that it is a very subjective measurement; it depends a lot in the reader’s eye. Therefore we had to use the same person for every secchi disk measurement.
Another thing is that when we measured the turbidity in the rivers, the water moved the secchi disk forward, so it was really difficult to see exactly when it was seen and disappeared. We should have used a secchi disk with a straight stick holding it, instead of a string.
The problem here was the slippery soil, we should have counted hoe many plants there where in the different levels from the opposite side of the river, and do a vague sketch for being able to approve or reject the hypothesis.
The temperatures where done in different times of the day, with different weather; this altered the readings. We should have done the reading all in one day, or at least in different days but with similar weathers.
The whole project was done in different days with different weathers. It should have been done in the same day; the problem was that the sites are to far away from each other. Therefore we should’ve at least do the sites we where comparing from each other the same day, by sending different groups of people to each site that day. This way the results where done in similar conditions.
I tried to do the Gini coefficient method and many other statistical methods but I didn’t have the right type of data and of the data I had I didn’t have the right amount to do one more so I couldn’t do it.
I may have extended the project by analyzing the rocks in the basin to see and prove the manning roughness coefficient. This may have helped me prove if the river’s rocks do get smaller as getting to the end of the river.
I could have also analyzed the rain, by collecting samples of it the day it rained and testing its pH with the pH tester we took. This way we would see if the Tambopata rainforest is being affected by the pollution in the cities nearby, like Puerto Maldonado, and has an acidic rainfall and this would also affect the pH of the river.
I could also have tested the pH of the water in the Tambopata River right after they flowed through each lodge to see if the lodges increased the pollution of the river.
Bibliography
- Google Earth
- WAUGH David, Geography, An internal Approach
- geography.about.com
-
-
-
-
- www.nfrflood.com/indterms_toc.html
Appendix
Velocity calculations sites A and B
The average time taken by the sticks in Site A:
All the times summed .
The number of sticks thrown
=
= 22.31 seconds
Now the average velocity is taken:
= 0.45 m/seconds
The velocity for Site B:
Average time taken by each stick =
= 8.46 seconds
Average velocity= = 1.18 m/sec.
Discharge calculations
Site A:
Mean of deepness = 79.7
Cross Sectional Area = 16 x 79.7
= 1275.2 m2
Discharge = 0.45 x 1275.2 = 573.8 m/sec3
Site B
Mean of Deepness = 36.3
Cross Sectional area = 19 x 36.3
= 689.7 m2
Discharge = 1.18 x 689.7 = 813.9 m/sec3
WAUGH David, Geography, An internal approach. Pg 63
Waugh David, Geography, An integral approach, pg.146
WAUGH David, Geography, An integral approach Pg. 65