- First, Investigation was taken place to identify the sites where transects & quadrant’s would be implemented in order to study the vegetation of the area.
- First, To record the vegetation present we used the quadrant technique at two different areas.
AREA-1(Terrace)
- At 4 sample stations, a quadrant was placed.
- Types of plants in the quadrants were observed and noted down.
- Lengths/sizes of plants were measured and Noted.
- The percentage cover of quadrants was recorded for each site.(Vegetated & dry )
- Samples of few of these plants were collected for further investigation.
AREA-2(Forest)
- At 4 sample stations, a quadrant was placed.
- Types of plants in the quadrants were observed and noted down.
- Lengths/sizes of plants were measured and Noted.
- The percentage cover of quadrants was recorded for each site.(Vegetated & dry)
- Samples of few of these plants were collected for further investigation.
Transects
- 2 sites were marked in the forest to undertake the vegetation study by the use of transects
- A transect of 25m was taken at both the sites from one side of the forest to another.
- Starting from 25m, readings were taken taken after every 3m-5m.
- Various types of plants and trees were observed and noted down.
- Samples of plants were kept in a Ziploc bag for further investigation.
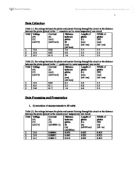
Data Collection and Processing
Quadrant Area 1(Terrace)
Terrace 1
- 80% of the area covering the quadrant was dry.
- 20% of the area covering the quadrant was vegetated.
Many observations were made while studying the vegetation at site 1.
- 6 Twigs were present accompanied with an average height of 6.5 inches.
- 10 blades of green grass were visible with an average height of 4 inches.
- Majority of the quadrant was covered with crab grass.
- Minor part of the quadrant was present with bare dirt.
Terrace 2
- 97% covered in vegetation.
- 3 % covered in bared dirt
Observations made in the Quadrant:
- 8 plants were observed with an average height of 3 inches
- High levels of Green grass were present with an average height of 7 inches.
Terrace 3
- 75% of the quadrant covered was dry.
- 20% of the quadrant was filled with bare dirt
- Very less vegetation level was present in this sight, at 5%
Other observations made in the quadrant:
- 75% of dry grass was present in the quadrant with an average height of 7 inches
- 4 plants were observed with an average height of 4 inches.
Terrace 4
- 70% of the quadrant covered was vegetated
- 30% of the quadrant covered was dry.
Observations made in the Quadrant:
- Many Blades of green grass present with an average height of 7 inches. This Covered 50% of the quadrant.
- 7 various types of plants observed with an average height of 4 inches.
Area 1(Vegetation level in Terrace)
Average Vegetation in Area 1: 48%
Area 2(Forest)
Quadrant 1:
- 32% of the quadrant covered was vegetated
- 65% of the quadrant covered was dry.
- 3% of the quadrant covered was bare ground
Other observations made-
- Part of the quadrant that was dry mainly compromised of dry twigs and leaves.
- Few leaves and small plants were detected at Vegetated component of the quadrant.
Quadrant 2:
- 70% of the quadrant covered was vegetated
- 20% of the quadrant covered was dry
- 10% of the quadrant covered was bare land.
Other observations made:
- Component of the quadrant that was vegetated was detected with 8 mine tike plants and various big plants
- Many rocks and dried leaves were detected on the component of the quadrant that was vegetated.
Quadrant 3:
- 15% of the quadrant covered was vegetated.
- 85% of the quadrant covered was Dry.
Other observations made:
- Lot of barren ground and sand was present within the quadrant
- Dried leaves and twigs were present within the quadrant
Quadrant 4:
- 20% of the quadrant covered was vegetated
- 80% of the quadrant covered was dry
Other observations made:
- Barren soil & dry leaves were a component of the 80% of the quadrant that was dry
- Leaves and plants(average height of 1.5 inches) observed were minor additions to the component of the quadrant that was vegetated.
Vegetation Level of Area 2
Average Vegetation Level of Area 2: 34.25%
Transects
Transect 1-
- 0-1m-Bamboo plant
- 3m-10 foot tree
- 4m-25 foot tree
- 5m 20-Bush
- 5m 70-30 foot Teak tree
- 10m- 25 Foot tree
- 18m 70-Vine Plant
- 22m-13 inch small plant
- 24 m-Small dead plant
Transect 2
- 0m-2 foot plant
- 2m 80-10m Teak Tree
- 5m 40-Teak Tree
- 6m 10- 1 foot plant
- 9m 80-20 foot Teak Tree
- 10m 80- 3 foot plant
- 12m 50-2 foot plant
- 18m 30-Vine Plant
- 22m 30-Baby Teak Tree 7 foot
- 23 m-Small 1 Foot Plant
Conclusion-
The main findings of this study of vegetation in Terrace and Forest are that this sensitive environment is intricately balanced by the maintenance of its vegetation. Based on the readings above we are able to identify that vegetation levels in Area 1 i.e. Terrace is much higher than Area 2 i.e. Forest. One of the sole reasons to this can be, Sunlight-Since plant can absorb more sunlight in Area 1 since not many Trees are blocking sunlight for plants and grass unlike in Area 2 where plant growth is very limited due to blockage of sunlight. This factor will affect plant growth thereby Vegetation. Continuous harvesting of plants and grass in area 1 has lead to higher vegetation levels present there unlike Area 2 where Major parts of quadrant were covered with dry soil, twigs and leaves were an evident factor to conclude lack of harvesting in Area 2.Presence of many plants in Area 1 is another indication of a typical health land vegetation. Major Component covered with Dry soil served as a factor to low nutrient in soil in Area 2 rather than in Area 1, where minor dry land was discovered.
Therefore findings & conclusion of this vegetation study is that relationship between the vegetation of the two areas (Forest & Terrace) is influenced by external factors such as soil & harvest and environmental factors such as sunlight. Therefore Area 1(terrace) has a much healthier Vegetation compared to Area 2(forest).
Evaluation:
From our research and findings on this experiment we have discovered that Area 1(Terrace) has a much healthier vegetation compared to Area 2(forests).However based on the data collection processing,Pattern or relation with Vegetation level with both the areas are very limited.However during the experiment there were many limitations:
- The field work & investigative tests were carried out by small groups of students. This could have distorted the findings as techniques may have varied & been inconsistent. Each group was made aware of what & how the data needed to be obtained to keep it as consistent as possible.
- Time limits on the data collection may also have meant that there was less accuracy in the other recorded results.
- Although trouble was taken to correctly label samples & record data, the sample station data from 25 metres became contaminated by human error. This meant that no comparison could be drawn from these stations. This could have been avoided if there had been a less pressurised time limit to the field work & tests.
- Experiment being carried out once ,may have lead to less accurate results for the vegetation study.
- Transect study being carried out on one area rather on two different areas may have distorted results.
- Testing vegetation levels only by the means of transects & quadrants, means testing methods were very limited
Therefore these steps can be carried out to to improve the experiment and obtain results more specific and accurate:
- Larger groups of students may be utilized to keep results as consistent as possible and improve results.
- Time can be increased for data collection to collect sufficient data to improve accuracy.
- It would also be interesting to see, if experiment could be performed repeatedly at different times of the year and observe if any changes in vegetation levels occur and make comparisons.
- Rather than the transect study being more fixed to one area, it can be studied for two areas rather than two sites at one area. By implementing this method comparisons can be made and result for vegetation level may improve.
- Besides employing transect & quadrants to study vegetation level, Tests on soil such as pH, moisture content may be conducted to make comparisons with vegetation and soil of the areas.