And with the data points included:
When graphed with Excel, a function of y = 46.096x-1.154 is found to be the best model of the data provided. Here it is graphed with comparison to my model:
And with the data points:
As you can see, the function produced by me and the function produced by technology only differ slightly. The technologically found function uses different parameters, but still has the same variables. Each function is not an exact fit to the data, but both models are fairly close.
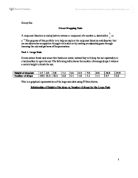
The following table shows the average number of drops it takes to break open a medium nut from varying heights.
Medium Nuts
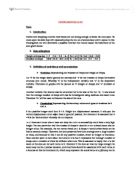
When graphed with my large nut function, it appears as follows:
My function needs to be adjusted a little bit to the right to make the curve fit better with the data points. To do this, my b value needs to be increased to 3i. This makes the function now: (47(x-3)-1.5) + 1. After the slight adjustment, the graph now appears as the following:
My model/function now fits the medium nut data better after this adjustment. This function is limited though. It would be better to create a whole new function to account for the medium nut size than to use the model from the large nut size. This new model/function would possibly create a better fit than using the large nut size function.
The following table shows the average number of drops it takes to break open a medium nut from varying heights.
Small Nut
When graphed with my large nut function, it appears as follows:
My function needs to be adjusted a little bit to the right to make the curve fit better with the data points. To do this, my b value needs to be increased to 3, and my d value needs to be increased to 9. This makes the function now: (47(x-3)-1.5) + 9. After the slight adjustment, the graph now appears as the following:
My model/function now fits the small nut data better after this adjustment. This function is limited though. It would be better to create a whole new function to account for the medium nut size than to use the model from the large nut size. This new model/function would possibly create a better fit than using the large nut size function. Also, the data for the small nut seems more erroneous and spread out with lots of extremities. My model gives a good representation of the small nut data, but is not an exact fit, making this model limited.
In this project, I created functions that served as models for various sizes nuts. Using this data properly, one could possible predict the amount of drops it might take to crack open a nut from even more heights than are listed here.