Use the transitive property: a = a, therefore 21.0/2.0^b = 4.4/7.0^b
Solve for b: 21.0/2.0^b = 4.4/7.0^b
7.0^b/2/0^b = 4.4/21.0
(7.0/2.0)^b = 4.4/21.0
blog(7.0/2.0) = log(4.4/21.0)
b = log(4.4/21.0)/log(7.0/2.0)
b ≈ -1.25
Substitute b to solve for a: a = 21.0/2.0^-1.25
Substitute b to solve for a: a ≈ 49.9
Equation: f(x) = 49.9x^-1.25
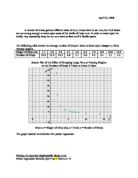
Scatter Plot of the Effect of Dropping Large Nuts at Varying Heights
on the Number of Drops It Takes to Crack It Open and the Line f(x) = 49.9x^-1.25
where x = Height of Drop (m); x > 0 and y = Number of Drops
The parameters are a and b.
The choice of ordered pairs was randomly selected. The line f(x) does not go through all points, but it does go through some making it a line of best fit.
Finding the equation using a graphing calculator (large nuts)
-
Hit the STAT button. Select 1: Edit. To clear the lists, move the cursor to the top of the column until the heading is highlighted and press CLEAR, then ENTER. Enter the data for the “Height of Drop (m)” in L1 and the data for the “Number of Drops” in L2.
-
Hit 2nd, then STAT PLOT. Press 1. Move the cursor to On and select it by pressing ENTER. Move the cursor to the line labeled Type. The first icon represents a scatter plot. Select the scatter plot type and press ENTER. Move the cursor to the line labeled Xlist and press 2nd, then LIST and select L1 to enter it as the variable x. Move the cursor to the line labeled Ylist and press 2nd, then LIST and select L2 to enter it as the variable y. Move the cursor to the line labeled Mark and press ENTER to select the first icon. This is the mark that will be used for each point in the scatter plot.
-
Hit GRAPH to display the scatter plot.
-
Return to and clear the home screen by pressing 2nd, QUIT, and then CLEAR. Hit the STAT button, move the cursor to CALC, and press ENTER. Move the cursor down to find PwrReg and select it by pressing ENTER. Hit ENTER again to receive the values for a and b.
Equation: g(x) = 46.1x^-1.15
Scatter Plot of the Effect of Dropping Large Nuts at Varying Heights
on the Number of Drops It Takes to Crack It Open and the Line g(x) = 46.1x^-1.15
where x = Height of Drop (m); x > 0 and y = Number of Drops
The parameters are a and b.
The line g(x) is slightly different from the line f(x). The line f(x) however, does go through more points than does the line g(x).
The following table shows the average number of drops it takes to break open a medium nut from varying heights.
Scatter Plot of the Effect of Dropping Medium Nuts at Varying Heights
on the Number of Drops It Takes to Crack It Open and the Line f(x) = 49.9x^-1.25
where x = Height of Drop (m); x > 0 and y = Number of Drops
The parameters are a and b.
The line f(x) does not apply to the scatter plot of medium nuts. The data points are above the line f(x). A change needs be made to this line. The value of a must be significantly increased.
Finding the equation using a graphing calculator (medium nuts)
For steps, see “Finding the equation using a graphing calculator (large nuts).” Apply data medium nuts in place of the large nuts.
Equation: m(x) = 99.1x^-1.25
Scatter Plot of the Effect of Dropping Medium Nuts at Varying Heights
on the Number of Drops It Takes to Crack It Open and the Line m(x) = 99.1x^-1.25
where x = Height of Drop (m); x > 0 and y = Number of Drops
The parameters are a and b.
This equation fits much better than f(x).
The following table shows the average number of drops it takes to break open a small nut
from varying heights.
Scatter Plot of the Effect of Dropping Small Nuts at Varying Heights
on the Number of Drops It Takes to Crack It Open and the Line f(x) = 49.9x^-1.25
where x = Height of Drop (m); x > 0 and y = Number of Drops
The parameters are a and b.
The line f(x) also does not apply to the scatter plot of small nuts. The data points again are above the line f(x). The change needs be made to this line. The value of a must be significantly increased and b may have to be slightly increased.
Finding the equation using a graphing calculator (medium nuts)
For steps, see “Finding the equation using a graphing calculator (large nuts).” Apply data small nuts in place of the large nuts.
Equation: s(x) = 137x^-1.10
Scatter Plot of the Effect of Dropping Small Nuts at Varying Heights
on the Number of Drops It Takes to Crack It Open and the Line s(x) = 137x^-1.10
where x = Height of Drop (m); x > 0 and y = Number of Drops
The parameters are a and b.
This graph fits much better than f(x).