The investigation will be clearer and more will result more relevant if we change and add a new variable on the investigation. This time the variable
will be shifted into 3, to see a clearer impact on the and have a more developed observation…
Relation between and (
Again, let’s plot a graph representing the relation between and .
This plot insure the proof that the value is increasing while the is also increasing. This time, the graph would not go further. It's noticeable that the asymptote of this graph is The limitation that I found in the first trial can be valid, by the statement that as, the values of , in this case it is also 3.
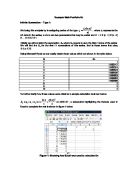
at the moment, I will evaluate the sum , when , and different values of . The different values of will be as following 0.5, 0.1, 25. First two trials with rational numbers then the third with a greater number than all the others trials. Before starting this evaluation, we can agree that the cannot be a zero or a negative value, , because the domain of is for positive numbers only as (),also we cannot take a zero beside (ln) as for instance: simply
Let’s try now the what we planned for, so first try the variable as
Relation between and
From this trial, the isn't behaving exponentially, the relation between rise and fall up and down, and then it reaches . However, my notice is that it still stands as when as , the values of . In this graph, also I noticed that a, the graph swing up and down. The graph may fluctuate up and down and varies below the asymptote, but will never intersect with the asymptote.
Now let's go for a small rational number to see what happens…
Relation between and
Then we plot it using technology (Microsoft excel)
This sequence of data has lots more of fluctuation than the previous trial when, on this trial where we found for the first time units under the zero, I have observed that the values less than zero are when (n) is an odd number, the graph fluctuates until with different variation, the more (n) is, the less the fluctuation is. This graph follows the constant general statement found previously that says , the values of
Now and finally let's try a quite big number in proportion with the previous trials, so now we have a=50, while
Here is the table:
Then we plot this set of data using technology (Excel):
From this set of data using a=50 we now are completely sure that there is always an asymptote on the value of a, also that if we have infinity of n, we will find the sum equals the a at the end...
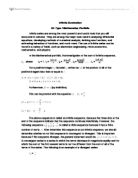
After investigating all the above trials and had a lot of observation about the relation between Sn and n, we finally found a general statement that represents the infinite sum of the general sequence which is , the values of . Which can be expressed as:
After getting the general statement that represents the infinite sum of the general sequence, we now have a next challenge concerning the expend of the investigation, let's see how:
It's given that that is the sum of the first n terms, for various values of.
Let a =2. We now have the unknown let's calculate it with different positive values of.
Relation between and
And now let's see this set of data on the graph…
Now we can see how the graph behave exponentially, which was predicted by me before investigating because the function was which resemble the exponential function, Beside that we can agree also that the two variables evaluated are positively correlated, as when the x values increases, the values of T9(2,x) will increase as a result. Another observation that enhance the investigation evaluation, we came on the previous investigation with a general rule , the values of , which we have insured its validity by finding in the graph the base 2, and 2 is the x which equals a, So now we can write it a ....
Now let's try a=3, meaning that
By using Excel we came with this graph…
In this second trial on the extended investigation, it is noticeable that the function is . The only variable and change is the value, also as I mentioned above, the x values increases, the values of will increase at an exponential rate. So we can now be sure of our statement saying that: .
To more insure this statement and go for it in more depth, I tried another trial using , I observed that there is a quite big difference concerning the result, between the algebraically and geographically ones or it appears also on the tables, as by looking at the graph, , but on the calculator I found 3 at the power of 5 equals 243.000000. This may be considered as a limitation of the investigation. But the situation was treated by the fact that we are only using the 9th term of the sequence, but if we increase the n value the difference will decrease until it reaches the same result, and the n that equals the algebraically result, is the final term in the sequence...
Now finally getting the final general statements discovered in the investigation, by all the trials above analysis we can finally say that:
Firstly as the value approaches , the values of will approach This relation can be represented as:
The domain of the general statement is:
So now we can say that:
With respect to domain listed above...
Finally let's test the validity of the general statement by using variables a and x…
END OF THE INVESTIGATION...