S3= S2+t3=2.923081
S4= S3+t4=2.983779
S5= S4+t5=2.997115
S6= S5+t6=2.999557
S7= S6+t7=2.999940
S8= S7+t8=2.999993
S9= S8+t9=2.999999 217
S10= S9+t10=2.999999 923
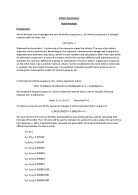
This diagram shows the relation between Sn and n using the gained results. (Diagram Microsoft Excel)
Now again, it is possible to see relating on the diagram and the table, that when n increases, the value of Sn increases as well. This time the first 5 values of n show a visible steady increase. The complete data collection for the equation, suggests that when n is ∞, when x=1 and a =3, the sum will equal to 3. This may suggest that the domain for the function is 1≤Sn≤3.
Now a general sequence where x=1, will be considered.
Taking all data collected into account a relation between a and ∞ has shown. So as the two sets of results show a=2 or a=3, the total of sum won’t exceed 2 or 3, when x=1. To prof this suggestion right, two more examples will be made, again when x=1 and the domain for n is 0≤n≤10, to prof the theory reliable.
For this task, the values of a to prof the reliability will be a=10 and a=e.
For the third example, it will follow the same rules as in the two previous examples, but now x=1 and a=10.
Again, the sum of the first 11 terms, 0≤n≤10, starting with S0 and ending with S10, will be calculated with the help of the GDC. The same method and notation will be used, as in the sequences before.
S0= t0=1
S1= 1+t1=3.302585
S2=S1+t2=5.953534
S3= S2+t3=7.988213
S4= S3+t4=9.159468
S5= S4+t5=9.698851
S6= S5+t6=9.905847
S7= S6+t7=9.973936
S8= S7+t8=9.993534
S9= S8+t9=9.998548
S10= S9+t10=9.999702
This diagram shows the relation between Sn and n using the gained results. (Diagram Microsoft Excel)
Now again, it is possible to see relating on the diagram and the table, that when n increases, the value of Sn increases as well. The complete data collection for the equation, suggests that when n is ∞, when x=1 and a =10, the sum will equal to 10. This may suggest that the domain for the function is 1≤Sn≤10.
For the fourth example, it will follow the same rules as in the two previous examples, but now x=1 and a=e. The Euler value will be considered as the value 2.718281828…
Again, the sum of the first 11 terms, 0≤n≤10, starting with S0 and ending with S10, will be calculated with the help of the GDC. The same method and notation will be used, as in the sequences before.
S0= t0=1
S1= 1+t1=2
S2=S1+t2=2.5
S3= S2+t3=2.666667
S4= S3+t4=2.708333
S5= S4+t5=2.716667
S6= S5+t6=2.718056
S7= S6+t7=2.718254
S8= S7+t8=2.718279
S9= S8+t9=2.718281 527
S10= S9+t10=2.718281 803
This diagram shows the relation between Sn and n using the gained results. (Diagram Microsoft Excel)
It is possible to see relating on the diagram and the table, that when n increases, the value of Sn increases as well, so for all four examples this statement is true which makes it reliable, for all positive numbers. The complete data collection for the equation, suggests that when n is ∞, when x=1 and a =e, the sum will equal to e. This may suggest that the domain for the function is 1≤Sn≤e. This may suggest that when n approaches ∞, n will approach a, all four data sets from befor support this statement.
From the collected data a general statement can be deduced, which simplifies calculations to the point of ∞. For this the general sequence given in the beginning should be taken into account,
t0=1, t1=(xlna)1,t2=(xlna)22×1,t3=(xlna)33×2×1 …,tn=(xlna)nn!…
From this combined with the collected information, it became clear that when n approaches ∞, the sum of ∞ will be equal to a. This deduces the general statement as such,
The investigation will now be expanded, to determine the sum of the infinite sequence tn, where
Tn(a,x) will be defined as the sum of the first n terms, which will be done for various values of a and x. For example when T4(4,8) it is the sum of the first four terms when a=4 and x=5.
The value of a will be 2, so different positive values of x will be used to state the relation between T9(2,x) and x. For this example the values of x will be 1,2,3,4,5,6,7,8,9,10
T9(2,1) = 1+(1 ln 2)/1 + (1 ln 2)2/2x1 + (1 ln 2)3/3x2x1 +…
=1.999998
T9(2,2) = 1+(2 ln 2)/1 + (2 ln 2)2/2x1 + (2 ln 2)3/3x2x1 +…
=3.999939
T9(2,3) = 1+(3 ln 2)/1 + (3 ln 2)2/2x1 + (3 ln 2)3/3x2x1 +…
=7.997485
T9(2,4) = 1+(4 ln 2)/1 + (4 ln 2)2/2x1 + (4 ln 2)3/3x2x1 +…
=15.963512
T9(2,5) = 1+(5 ln 2)/1 + (5 ln 2)2/2x1 + (5 ln 2)3/3x2x1 +…
=31.7021312
T9(2,6) = 1+(6 ln 2)/1 + (6 ln 2)2/2x1 + (6 ln 2)3/3x2x1 +…
=62.305350
T9(2,7) = 1+(7 ln 2)/1 + (7 ln 2)2/2x1 + (7 ln 2)3/3x2x1 +…
=120.465724
T9(2,8) = 1+(8 ln 2)/1 + (8 ln 2)2/2x1 + (8 ln 2)3/3x2x1 +…
=227.963677
T9(2,9) = 1+(9 ln 2)/1 + (9 ln 2)2/2x1 + (9 ln 2)3/3x2x1 +…
=420.699406
T9(2,10) = 1+(10 ln 2)/1 + (10 ln 2)2/2x1 + (10 ln 2)3/3x2x1 +…
=755.692614
This diagram shows the relation between T9(2,x) and x using the gained results. (Diagram Microsoft Excel)
This diagram shows that when x increases, the value of T9(2,x) will increase too. As x increases the curve slopes up regularly.
Now the value of a will be changed to 3 giving T9(3,x) and leaving x to be changed. For this example the values of x will be 1,2,3,4,5,6,7,8,9,10 as in the first example.
T9(3,1) = 1+(1 ln 3)/1 + (1 ln 3)2/2x1 + (1 ln 3)3/3x2x1 +…
=2.999993
T9(3,2) = 1+(2 ln 3)/1 + (2 ln 3)2/2x1 + (2 ln 3)3/3x2x1 +…
=8.995812
T9(3,3) = 1+(3 ln 3)/1 + (3 ln 3)2/2x1 + (3 ln 3)3/3x2x1 +…
=26.814823
T9(3,4) = 1+(4 ln 3)/1 + (4 ln 3)2/2x1 + (4 ln 3)3/3x2x1 +…
=78.119155
T9(3,5) = 1+(5 ln 3)/1 + (5 ln 3)2/2x1 + (5 ln 3)3/3x2x1 +…
=217.471546
T9(3,6) = 1+(6 ln 3)/1 + (6 ln 3)2/2x1 + (6 ln 3)3/3x2x1 +…
=569.033837
T9(3,7) = 1+(7 ln 3)/1 + (7 ln 3)2/2x1 + (7 ln 3)3/3x2x1 +…
=1390.256867
T9(3,8) = 1+(8 ln 3)/1 + (8 ln 3)2/2x1 + (8 ln 3)3/3x2x1 +…
=3174.042569
T9(3,9) = 1+(9 ln 3)/1 + (9 ln 3)2/2x1 + (9 ln 3)3/3x2x1 +…
=6802.981103
T9(3,10) = 1+(10 ln 3)/1 + (10 ln 3)2/2x1 + (10 ln 3)3/3x2x1 +…
=13771.387940
This diagram shows the relation between T9(2,x) and x using the gained results. (Diagram Microsoft Excel)
This diagram shows the same results as when T9(2,x), so that when x increases, the value of T9(3,x) will increase too. As x increases the curve slopes up regularly.
Continuing with the analysis to find the general statement for Tn(a,x) as n approaches ∞. This general statement will be continue to be used to find a precise formula for this task. This will be done by using two more values of a with the same values of x as before (1,2,3,4,5,6,7,8,9,10).
For the first example, a=10 when Tn is T7,
T7(10,1) = 1+(1 ln 10)/1 + (1 ln 10)2/2x1 + (1 ln 10)3/3x2x1 +…
=12.208432
T7(10,2) = 1+(2 ln 10)/1 + (2 ln 10)2/2x1 + (2 ln 10)3/3x2x1 +…
=81.734466
T7(10,3) = 1+(3 ln 10)/1 + (3 ln 10)2/2x1 + (3 ln 10)3/3x2x1 +…
=463.544311
T7(10,4) = 1+(4 ln 10)/1 + (4 ln 10)2/2x1 + (4 ln 10)3/3x2x1 +…
=1882.869389
T7(10,5) = 1+(5 ln 10)/1 + (5 ln 10)2/2x1 + (5 ln 10)3/3x2x1 +…
=5985.037734
T7(10,6) = 1+(6 ln 10)/1 + (6 ln 10)2/2x1 + (6 ln 10)3/3x2x1 +…
=15919.5269..
T7(10,7) = 1+(7 ln 10)/1 + (7 ln 10)2/2x1 + (7 ln 10)3/3x2x1 +…
=37075.35646.
T7(10,8) = 1+(8 ln 10)/1 + (8 ln 10)2/2x1 + (8 ln 10)3/3x2x1 +…
=77965.51753.
T7(10,9) = 1+(9 ln 10)/1 + (9 ln 10)2/2x1 + (9 ln 10)3/3x2x1 +…
=151260.4393..
T7(10,10) = 1+(10 ln 10)/1 + (10 ln 10)2/2x1 + (10 ln 10)3/3x2x1 +…
=274970.4925..
This diagram shows the relation between T7(10,x) and x using the gained results. (Diagram Microsoft Excel)
This diagram shows the same results as when T9(2,x) and T9(3,x), so that when x increases, the value of T7(10,x) will increase too. As x increases the curve slopes up regularly.
For the first example, a=e when Tn is T7,
T7(e,1) = 1+(1 ln e)/1 + (1 ln e)2/2x1 + (1 ln e)3/3x2x1 +…
=2.718056
T7(e,2) = 1+(2 ln e)/1 + (2 ln e)2/2x1 + (2 ln e)3/3x2x1 +…
=7.355556
T7(e,3) = 1+(3 ln e)/1 + (3 ln e)2/2x1 + (3 ln e)3/3x2x1 +…
=19.4125
T7(e,4) = 1+(4 ln e)/1 + (4 ln e)2/2x1 + (4 ln e)3/3x2x1 +…
=48.555556
T7(e,5) = 1+(5 ln e)/1 + (5 ln e)2/2x1 + (5 ln e)3/3x2x1 +…
=113.118056
T7(e,6) = 1+(6 ln e)/1 + (6 ln e)2/2x1 + (6 ln e)3/3x2x1 +…
=244.6
T7(e,7) = 1+(7 ln e)/1 + (7 ln e)2/2x1 + (7 ln e)3/3x2x1 +…
=493.168056
T7(e,8) = 1+(8 ln e)/1 + (8 ln e)2/2x1 + (8 ln e)3/3x2x1 +…
=934.155556
T7(e,9) = 1+(9 ln e)/1 + (9 ln e)2/2x1 + (9 ln e)3/3x2x1 +…
=1675.5625
T7(e,10) = 1+(10 ln e)/1 + (10 ln e)2/2x1 + (e ln e)3/3x2x1 +…
=2866.555556
This diagram shows the relation between T7(10,x) and x using the gained results. (Diagram Microsoft Excel)
This diagram shows that when x increases the value of T7(e,x) will increase as well.
To prove that this thereoy will respond to a change, the singne will be change to negative, to prove this a few negative values of x will be taken where a is constant. The negative values of x will be -1,-3,-5 and -7 and a=2 when T9(a,x).
T9(2,-1) = 1+(-1 ln 2)/1 + (-1 ln 2)2/2x1 + (-1 ln 2)3/3x2x1 +…
=0.500000
T9(2,-3) = 1+(-3 ln 2)/1 + (-3 ln 2)2/2x1 + (-3 ln 2)3/3x2x1 +…
=0.126654
T9(2,-5) = 1+(-5 ln 2)/1 + (-5 ln 2)2/2x1 + (-5 ln 2)3/3x2x1 +…
=0.177919
T9(2,-7) = 1+(-7 ln 2)/1 + (-7 ln 2)2/2x1 + (-7 ln 2)3/3x2x1 +…
=2.743859
This diagram shows the relation between T9(2,x) and x using the gained results. (Diagram Microsoft Excel)
This graph shows none of the previous observations, which states that when this sequence is taken into the negative area, the general statement becomes false.
To sum up the result, it is possible to say that the formula used in the different steps is only valied for the statement Tn(a,x) for positive values.