For y = xπ:
area A: area B = 3.12: 1 ≈ π: 1
For y = xe:
area A: area B = 2.72: 1 ≈ e: 1
For y = x100:
area A: area B = 100: 1
For these three real numbers, the conjecture holds true: area A: area B = n: 1.
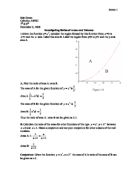
y = xn between the points x = 0 and x = 2:
Above the conjecture ratio area A: area B = n: 1 has been made for the graph y = xn between the points x = 0 and x = 1.
Now the conjecture must be tested for different arbitrary points.
Consider the points between x = 0 and x = 2.
Area A will be the area contained between the graph of y = xn and the x-axis between the points x = 0 and x= 2.
Area B will be the area contained between the graph of y = x1/n and the x-axis between the points x = 0n (= 0) and x = 2n.
From these results it is evident that the conjecture holds true for the points between x = 0 and x = 2.
y = xn between the points x = 1 and x = 2:
Area A will be the area contained between the graph of y = xn and the x-axis between the points x = 1 and x= 2.
Area B will be the area contained between the graph of y = x1/n and the x-axis between the points x = 1n (= 1) and x = 2n.
From these results it is evident that the conjecture holds true for the points between x = 1 and x = 2.
y = xn between the points x = e and x = π:
Area A will be the area contained between the graph of y = xn and the x-axis between the points x = e and x= π.
Area B will be the area contained between the graph of y = x1/n and the x-axis between the points x = en and x = πn.
From these results it is evident that the conjecture holds true for the points between x = e and x = π.
Proving the Conjecture:
From the above data the following conjecture has been made:
Ratio area A: area B = n: 1 for any graph of the form y = xn in between the arbitrary points x = a and x = b so that a<b.
This conjecture can be proven using calculus.
The area under a graph is equal to the integral of the graph in between the two arbitrary points:
Area B:
Area B is the area under the graph of y = xn in between the arbitrary points a and b. Therefore area B can be expressed as the following:
Area A:
Area A is the area under the graph of y = x1/n in between the arbitrary points an and bn.
Therefore area A can be expressed as the following:
Ratio area A: area B
Part ii:
Introduction:
In this investigation the ratio of the volumes formed around the x-axis when y = xn is graphed between two arbitrary parameters x = a and x=b such that a<b will be investigated.
This investigation will investigate the ratio volume A: volume B.
Volume A is the volume contained around the x-axis between the graph of y = xn and the y-axis.
Volume B is the volume contained around the x-axis between the graph of y = xn and the x-axis.
However, to find Volume A using modern technology is tricky.
Volume A can be expressed in another manner. Consider the horizontal line that meets the graph at the point x = b (y = bn):
Volume A can be considered as the volume contained around the x-axis by the graph of this horizontal line (y = bn) between the points x = 0 and x = b subtracted by volume B and the volume contained around the x-axis by the graph of y = an between the points x = 0 ans x = a. This last volume will be considered as volume C.
This method will be used to find the ratio Volume A: Volume B.
Investigation:
y = x2 between x = 0 and x = 1:
Consider the graph of y = x2 between the points x = 0 and x = 1.
Volume B will equal the volume contained around the x-axis between the graph and the x-axis between the points x = 0 and x = 1.
Volume A will equal the volume contained around the x-axis between the graph of y = 12 (= 1) and the x-axis between the points x = 0 and x = 1 subtracted by volume B. (Note: since in this case a = 0 volume C = 0).
Using the program Autograph 3.20 the following results are obtained:
Volume B = 0.2π
Volume under y = 1 = 1π
Volume A = 1 - 0.2π = 0.8π
Ratio volume B: volume A = 0.8π: 0.2π
= 4: 1
y = xn between x = 0 and x = 1:
Now consider other functions of the type y = xn, n Z+ between the points x = 0 and x = 1.
Volume B will be the volume contained around the x-axis between the graph and the x-axis between the points x = 0 and x = 1.
Volume A will be the volume contained between the line y = 1n (= 1) and the x-axis between the points x = 0 and x = 1 subtracted by volume B (volume C = 0).
Below is a table for the results of volume B, volume under the horizontal line, volume A and the ratio volume A / volume B for the values of n between 2 and 10.
From the above data the following conjecture can be made:
Ratio volume A: volume B = 2n: 1.
Testing the conjecture:
The conjecture will be tested against the two real numbers π and e.
For y = xπ
Ratio volume A: volume B = 6.28: 1 ≈ 2π: 1
For y = xe
Ratio volume A: volume B = 5.44: 1 ≈ 2e: 1
From these results it is evident thst the conjecture holds true.
y = xn between the points x = 0 and x = 2:
Above the following conjecture has been made:
Ratio volume A: volume B = 2n: 1.
Now this conjecture must be tested for other arbitrary points such that a<b.
Consider the points x = 0 and x = 2.
Volume B will be the volume contained around the x-axis between the graph and the x-axis between the points x = 0 and x = 2.
Volume A will be the volume contained around the x-axis between the horizontal line y = 2n and the x-axis between the points x = 0 and x = 2 subtracted by volume B (volume C = 0).
From these results it is evident that the conjecture holds true between the points x = 0 and x = 2.
y = xn between the points x = 1 and x = 2:
Volume B will be the volume contained around the x-axis between the graph and the x-axis between the points x = 1 and x = 2.
Volume A will be the volume contained around the x-axis between the horizontal line y = 2n and the x-axis between the points x = 0 and x = 2 by volume B and volume C.
Volume C will be the volume contained around the x-axis between the graph of y = 1n (= 1) and the x-axis between the points x = 0 and x = 1.
From these results it is evident that the conjecture holds true between the points x = 1 and x = 2
y = xn between the points x = e and x = π:
Volume B will be the volume contained around the x-axis between the graph and the x-axis between the points x = e and x = π.
Volume A will be the volume contained around the x-axis between the horizontal line y = πn and the x-axis between the points x = 0 and x = π by volume B and volume C.
Volume C will be the volume contained around the x-axis between the graph of y = en and the x-axis between the points x = 0 and x = e.
From these results it is evident that the conjecture holds true between the points x = e and x = π.
Proving the conjecture:
Using calculus the conjecture can be proven.
Volume B:
Volume A:
Ratio volume A: volume B:
Part iii:
Introduction:
In this investigation the ratio of the volumes formed around the y-axis when y = xn is graphed between two arbitrary parameters x = a and x=b such that a<b will be investigated.
This investigation will investigate the ratio volume A: volume B.
Volume A is the volume contained around the y-axis between the graph of y = xn and the y-axis formed between the arbitrary parameters x = a (y = an) and x = b (y = bn).
Volume B is the volume contained around the y-axis between the graph of y = xn and the x-axis between the arbitrary parameters x = a and x = b.
However, using modern technology it is difficult to find the volume around the y-axis. To resolve this problem, the inverse equation is used (similar to part i).
This gives the equation y = x1/n.
Now volume A is the volume contained around the x-axis between the graph of y = x1/n and the x-axis formed between the arbitrary parameters x = an and x = bn.
Volume B is the volume contained around the x-axis between the graph of y = x1/n and the y-axis formed around the x-axis between the arbitrary parameters x = a and x = b.
However, it is again difficult to find volume B using technology therefore a similar method will be used as in part ii.
Volume B can be expressed as the volume contained around the x-axis between the graph of y = b and the x-axis between the points x = 0 and x = bn subtracted by volume A and by the volume contained around the x-axis between the graph of y = a and the x-axis between the points x = 0 and x = an. This last volume will be considered as volume C.
Investigation:
y = x2 between x = 0 and x = 1:
Considering the graph of y = x2 between the points x = 0 and x = 1
Volume A will equal the volume contained around the x-axis between the graph of y = x1/2 and the x-axis between the points x = 02 (= 0) and x = 12 (= 1).
Volume B will equal the volume contained around the x-axis between the graph of y = 1 and the x-axis between the points x = 0n (= 0) and x = 1n ( = 1) subtracted by volume A (Note: a = 0 therefore volume C = 0).
Using the program Autograph 3.20 the following results were found:
Volume A = 0.5π
Area under graph of y = 1 = 1π
Volume B = 1π – 0.5π
Ratio volume A: volume B = 1: 1
y = xn between x = 0 and x = 1:
Now consider other functions of the type y = xn, n Z+ between the points x = 0 and x = 1.
Volume A will equal the volume contained around the x-axis between the graph of y = x1/n and the x-axis between the points x = 02 (= 0) and x = 12 (= 1).
Volume B will equal the volume contained around the x-axis between the graph of y = 1 and the x-axis between the points x = 0n (= 0) and x = 1n (= 1) subtracted by volume A (a = 0 therefore volume C = 0).
Below is a table for the results of volume A, volume under the horizontal line, volume B and the ratio volume A / volume B for the values of n between 2 and 10.
From the above results the following conjecture can be made:
Volume A: Volume B = n: 2
Testing the conjecture:
The conjecture will be tested against the two real numbers π and e.
For y = xπ:
Ratio volume A: volume B ≈ π/2: 1 = π: 2
For y = xe:
Ratio volume A: volume B ≈ e/2: 1 = e: 2
For these real numbers the conjecture holds true.
y = xn between the points x = 0 and x = 2:
Above the following conjecture has been made:
Ratio volume A: volume B = n: 2.
Now the conjecture must be tested for other arbitrary points such that a<b.
Consider the points x = 0 and x = 2.
Volume A will equal the volume contained around the x-axis between the graph of y = x1/n and the x-axis between the points x = 02 (= 0) and x = 2n.
Volume B will equal the volume contained around the x-axis between the graph of y = 2 and the x-axis between the points x = 0n (= 0) and x = 2n subtracted by volume A (a = 0 therefore volume C = 0).
From these results it is evident that the conjecture holds true between the points x = 0 and x = 2.
y = xn between the points x = 1 and x = 2:
Volume A will equal the volume contained around the x-axis between the graph of y = x1/n and the x-axis between the points x = 1n (= 1) and x = 2n.
Volume B will equal the volume contained around the x-axis between the graph of y = 2 and the x-axis between the points x = 0 and x = 2n subtracted by volume A and volume C.
Volume C will equal the volume contained around the x-axis between the graph of y = 1 and the x-axis between the points x = 0 and x = 1n (=1).
From these results it is evident that the conjecture holds true between the points x = 1 and x = 2.
y = xn between the points x = e and x = π:
Volume A will equal the volume contained around the x-axis between the graph of y = x1/n and the x-axis between the points x = en and x = πn.
Volume B will equal the volume contained around the x-axis between the graph of y = π and the x-axis between the points x = 0 and x = πn subtracted by volume A and volume C.
Volume C will equal the volume contained around the x-axis between the graph of y = e and the x-axis between the points x = 0 and x = en.
From these results it is evident that the conjecture holds true between the points x = e and x = π.
Proving the conjecture:
Using calculus the conjecture can be proven.
Volume A:
Volume B:
Ratio volume A: volume B: