Investigating Sin Functions
Adam Hussain
IB Math SL - Internal Assessment (Practice)
Part 1 - (Y = A sin(x))
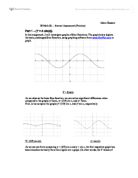
In this assignment, I will investigate graphs of Sine Functions. The graph below depicts the basic, unchanged Sine Function, using graphing software from www.FooPlot.com to graph.
Y = Sin(x)
As we observe the basic Sine function, we can notice significant differences when compared to the graphs y=2sinx, y= (1/3) sin x, and y= 5sinx.
First, let us compare the graphs y= (1/3) sin x, and y=sin x, respectively.
Y= (1/3) sin (x) y= sin (x)
As we can see from comparing y = (1/3) sin x and y = sin x, the first respective graph has been shrunken vertically from the original sin x graph. (In other words, the Y values of the graph have been shrunken by (1/3). Let's see what occurs when we use FooPlot to graph a Sin function with even lower A, or Amplitude.
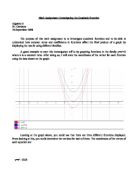
Y = sin(x) Y= (1/4) sin(x) Y= (1/8) sin(x)
As we examine these three graphs with decreasing "A" (amplitude) values, we can plainly see the graphs are shrinking vertically as "A" decreases.
Now, let's compare what happens when we decide to increase the amplitude, or A, when we enter the equation into the graphing software on FooPlot.
Y = 2sin(x) Y = sin (x)
Now, as we can see from comparing these graphs, y= 2sin(x) is a vertically stretched version of the original basic function y=sin (x), because the A (amplitude) was higher. This contention is supported even further as we continue to examine graphs with higher amplitudes. If we graph again with FooPlot, we get the following:
Y= 5 sin(x) Y = 2 sin(x)
As we compare the new graph with a higher Amplitude (y=5 sin(x)), we can see a tremendous, more pronounced difference from the previous graph than we did above because this time, there is a greater increase in the amplitude "A". The new graph of Y=5 sin (x) has been vertically stretched (its Y values have been multiplied by 5) to the point where the local extrema are no longer visible! From examining these graphs, it appears as though the graph becomes wider when A is increased. Let's further this by comparing three graphs side to side.
Y = sin(x) Y = 5sin(x) Y = 10sin(x)
As you can see, it appears as though increasing the value of "A" vertically stretches the Sine function graph. To further accentuate the transformation of the standard curve, and the change in the wave of the graph, I will now graph all three of the above graphs in the same window, using http://www.intmath.com.
Y= sin(x), Y= 5sin(x), Y= 10sin(x)
Judging from these graphs (now that they're in the same window), I can plainly see the major differences between the graphs. It's clear that the widest graph (vertically) is 10sinx, with 5sinx in second, sin(x) in third. As "A" increases, the "standard curve" of y = sin(x) becomes vertically wider, because it's being stretched (its Y Values are being multiplied by "A").
Now, from these graphs, one would likely assume that as the Amplitude of the graph increases, the shape vertically stretches, and as the Amplitude decreases, the graph ...
This is a preview of the whole essay
Y= sin(x), Y= 5sin(x), Y= 10sin(x)
Judging from these graphs (now that they're in the same window), I can plainly see the major differences between the graphs. It's clear that the widest graph (vertically) is 10sinx, with 5sinx in second, sin(x) in third. As "A" increases, the "standard curve" of y = sin(x) becomes vertically wider, because it's being stretched (its Y Values are being multiplied by "A").
Now, from these graphs, one would likely assume that as the Amplitude of the graph increases, the shape vertically stretches, and as the Amplitude decreases, the graph shrinks. However, one must consider possible limitations to this statement. Let me pose a question, what of negative numbers??
Since A would be decreasing to get negative numbers, would that make the graph shrink, because that follows logically with the above conclusions?
Well let's see...
Y = sin(x) Y = -1sin(x)
As we observe these graphs, we notice that the negative number placed in front of sin (x) did NOT shrink it vertically like we noticed above. In fact, it reflected it across the x axis, and kept the wave the same. To make this change easier to notice, refer to the graph below, made on FooPlot, of both graphs in the same window:
Red = -1sin(x), Black = sin(x)
So from this, we can see the graph hasn't changed in size, it was only reflected across the X Axis.
This begs the question - what happens as we continue down the negative number line? Take a look at y= -1sin(x), y = -2sin(x), and y= -3sin(x).
Y = -1sin(X) Y = -2sin(x) Y = -3sin(x)
As we can see from the graphs, as these Amplitude numbers decrease, the graph gets stretched more, which directly contradicts what we figured out above. How do I explain this? Well, first we should consider the definition of amplitude, which is the 1/2 distance between the local extrema (Maximum and Minimum). The key word here is distance. While displacement can be positive or negative, distance is always positive. Therefore, we have to consider that the negative sign shouldn't come into play as a factor affecting the height of the wave, and that it merely reflects the graph across the X axis. In order to do so, we should consider a way to make "A" always positive - by using absolute value.
If we consider absolute value, or |A|, then the above sequence of supposedly negative amplitudes ends up coinciding with the conclusions I drew from comparing the earlier graphs. Instead of looking at these decreasing numbers and asking how they could stretch the graph when we proved the converse earlier, if we take the absolute value, then these numbers become ascending positive numbers (1,2,3), and now the stretching of the graphs makes sense, and coincides with the earlier conclusion that the graph stretches vertically as A increases.
Conjecture - Part 1
Finally, we reach the conjecture. Initially, I would have assumed that as A increases, the graph would stretch vertically and make the wave longer vertically, and that as A decreases, the graph would shrink vertically and make the wave shorter vertically. But, once we considered the implications of negative symbols in front of the functions, I realize the conjecture is thus: As |A| increases, the graph stretches vertically by a factor of |A|, making the wave longer vertically, but not affecting it horizontally. And as |A| decreases, the graph shrinks vertically by a factor of |A|, making the wave shorter, but not affecting it horizontally. If A>1, the graph will stretch vertically, and if A<1, the graph will shrink vertically.
Part 2 - (Y = sin Bx)
In sinusoidal functions, B represents the number of cycles a graph completes in an interval of 0 to 2???This value B affects the period, which is the time interval for the function to happen, after which the function repeats itself. Graphically, the period is the length of one full cycle of the wave.
To see how B value affects the graph, let's graph it with FooPlot:
Y = Sin (x) Y = Sin (2x)
As we can see from the graphs, Sin (2x) is a compressed version of the original function. This new function has a shorter period because it now takes a shorter amount of time to finish a cycle. But by how much has it been compressed? We can determine this algebraically. Because the new period of a graph is determined by the equation 2??|b|, and the B value in this case is 2, the new period is 2?????r??. Now, we can determine algebraically how to get from 2??to ??a different way. If we divide ? by ??? we get 1/2. And this is the same as saying 1/|b|. Therefore, the graph changes by a factor of 1/|b|. We can further see this by taking a look at multiple graphs on one window:
Black = (y = sin(x)), Red = (y = sin(10x)), Blue is sin(5x);
As we can see from the graph, as B increases, the graph compresses, or shrinks more. Now let's see what happens when we decide to decrease the value of B:
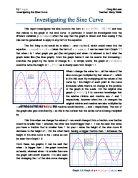
Black is y=sin(x), Red is y = sin (.5x), Blue is y = sin (.25x), Green is y = sin (.125x)
As we can see from this graph with multiple functions on it, as B decreases, the graph is being horizontally stretched. This is because the period is becoming longer, which happens because (2?/b) gives you the period. And because these b values are getting lower and becoming fractions, dividing by them is essentially the same as multiplying by the reciprocal. Because the smaller fractions have larger numbers as denominators, smaller fractions would increase the period more.
Now, what happens when the B value is negative?
*for above graph* Black is y=sin(-x), Red is y=sin(-2x), Blue is y=sin(-3x)
As we observe the graph, we can see that the negative symbol has reflected the graph across the y axis. However, the increasing B values still shrink the graph, coinciding with my initial conclusions. We have to consider the negative values as well - how do we avoid confusing the numbers and thinking they're negative, when they're actually reflecting? Again, we have to use Absolute Value. This leads to my conjecture.
Conjecture - Part 2
When |b|>1, the period of the function will be less than 2?, and the graph will be horizontally shrunk (making the wave shorter) by a factor of 1/|b|. And when |b| < 1, the period of the function will be greater than 2?? and the graph will be horizontally stretched (making the wave longer) by a factor of 1/|b|, with a reflection across the y axis is b < 0.
Part 3 - (y= sin(x+c))
In this equation, C represents a horizontal translation of the graph (known as Phase Shift) because it is adding on to or subtracting from the value of x, and X is the horizontal values of a graph. So if we take a look at a graph with subtracting C values:
Black is (y=sinx), Red is (y=sin(x-1)), Blue is (y=sin(x-2))
We get an unexpected result. The translation at first glance of the equation would have been to the left, because the subtraction from the X values. But instead, it's to the right...Let's try using positive adding values and see what happens:
Black is y=sinx, Red is (y=sin(x+1), Blue is (y=sin(x+2)
Now we can see that this translation, while having a plus sign, horizontally shifts to the left, not right as we might expect. Why is this? Let's investigate using the standard sinusoidal equation.
Sinusoidal equation - y= A sin (B(x-C)) + D
Note that in the standard form, C is being subtracted. The horizontal shift of the graph is determined by the value of C.
* Examples:
o (X+ 3) - Because C is being subtracted, this makes this equation X-(-3), making the value of C negative and the horizontal shift is to the left.
o (X-3) - Because C is being subtracted, and the actually value of C determines the shift, this shift is to the right because the actually value of C is positive 3.
This leads me to the conjecture:
Conjecture - Part 3
The graph of y = sin(x+C) is a translation of (y=sin x) by C units to the left when C > 0
The graph of y = sin (x-C) is a translation of (y=sin x) by C units to the Right when C > 0
The wave and the curve maintain the same shape, just in a different position.
OR
The graph will undergo a phase shift of (-C).
Part 4 - Findings
Part 4 calls for me to predict the shape and position of three equations
* Y = 3sin 2(x+2)
* Y = .5sin3(x+1)
* Y = -sin .5 (x-1)
For the first graph, it will be vertically stretched by a factor of 3, the graph will be compressed or shrunk horizontally by a factor of .5, making the graph complete a cycle in half the time (ending at ??, and the graph will be horizontally translated 2 units to the left of the origin. We can confirm this with FooPlot:
This graph confirms my prediction. In order to further support this, let's take a look at the graph over time, taking in one change at a time.
Black is y=sin(x+2)), Red is 3sin(x+2)), and Blue is 3sin(2(x+2), the final graph.
This proves I was correct. On to the next one:
/2 sin 3(x+1) is equal to 1/2 sin (3(x+1))
This graph will vertically shrink by a factor of (1/2), horizontally shrunk by a factor of (1/3), and horizontally translated to the left of the origin by one unit.
My graph confirms this:
Finally, let's look at -sin (1/2 (x-1)). This graph will be reflected across the x axis, horizontally stretched by a factor of 2, and horizontally translated to the right of the origin by one unit. My graph confirms this:
Using my conjectures, I can use the Amplitude of the equation to predict if it's horizontally stretched or shrunk, B to determine the period, and C to determine the horizontal translation.
Part 5 - Cosine Function
How is the graph of y= cos x linked to the graph y =sin x. What's the relationship?
Well let's start by comparing the graphs side by side using FooPlot. For the sake of comparison, I will use a different grapher to display the exact local extrema of the graphs.
<--This is y=sin(x), with a maximum at x= ??2
<-- This is y=cos(x)
<-- This is the overlap of both graphs.
According to the graph, in order to the get the Cos (x) curve from sin (x), we need to shift the sin curve by ??2 to the left.
Therefore, cos x = sin (x+ ??2)
And, if we refer back to the graph, it follows logically that to get the sine curve, we should shift the Cosine graph over ??2 to the right.
Therefore, sin x = cos (x- ??2)