For n=3, between x=0 and x=2:
For n=4, between x=0 and x=2:
I then tested the results for when. For n=2, between x=1 and x=2:
For n=3, between x=1 and x=2:
For n=4, between x=1 and x=2:
I then examined the results for when n is fractional. For n=, between x=0 and x=1:
For n=, between x=0 and x=1:
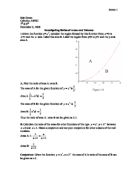
What if n is negative? A limit clearly cannot be set at x=0, but we must examine whether a pattern holds for these graphs also. As seen in the diagram above, whereas for positive n the areas are separate, for negative n they overlap (the dotted area above). For n=-2, between x=1 and x=2:
For n=-3, between x=1 and x=2:
Before making a general conjecture it would be wise to test for negative limits. For n=2, between x=-1 and x=0:
For n=2, between x=-2 and x=-1:
For n=3, between x=-1 and x=0:
Apart from two cases, the correlation (that ) seems to hold for the new limits. Any proof of the correlation must therefore explain the instances where it seems not to hold. To test further instances I produced a program on my Casio fx-9750G+ graphing calculator. The following program performs the above process automatically:
?→N
?→A
?→B
∫(Y^(1/N),A^N,B^N)/∫(X^N,A,B)
The following table demonstrates the results obtained using this program for several values of n, a, and b. Results which do not correlate with the observed pattern (and cannot be put down to the calculator’s internal rounding errors) are shown in bold.
There is a clear pattern visible, although certain cases do not fit. As well as confirming the pattern, my proof must also give reasons for the ‘anomalous’ values.
CONJECTURE: For a curve of the form, between x=a and x=b, a<b, the ratio A:B of the regions defined below is equal to n.
A: region bounded by the y-axis, the curve,, and .
B: region bounded by the x=axis, the curve, x=a, x=b.
PROOF: We follow the same process as used for the examples above, but more generally:
QED
There are some restrictions on the values that a, b, and n can take, which can be found with an examination of this proof. Because the expression occurs, it cannot be the case that n=0. Because occurs, we cannot have n=-1 (for the moment). Graphically it can be seen that A would always equal 0, so the rule would still hold. As we cancel the terms in the final stage, a must not equal b.
In addition to this, there are some restrictions which occur based on the value of n. The above is true for all 0<a<b, but imagine the situation when n=2, and a<0. There are no problems in calculating the area B, because is a function over all the real numbers. However, when we calculate A we use the function, and this does not give a real result for negative y. We must therefore ensure that the function is reversible over the limits used, i.e., but.
Finally, we must ensure that the function is actually defined over the whole region. For instance, if we use negative values of n, either 0<a<b or a<b<0 – 0 cannot be included in the region, as this would give infinite area.
This proof uses the power rule, which does not apply when n=-1. To show that the relationship holds in this instance, we must use a different rule:
Thus the relationship holds (given the right limits) for all.
Volumes of Revolution:
I will now investigate the ratios produced by rotating the areas A and B around the x- and y-axes. Firstly we will rotate around the x-axis, between x=0 and x=1 (to calculate A we subtract B from a cylinder with radius 1):
When limit , to calculate A we must divide the process into two stages. A1 is calculated by subtracting the dotted cylinder (radius an) from the cylinder with radius bn. A2 is calculated by subtracting B from the cylinder with radius bn. For n=2, between x=1 and x=2:
For n=3, between x=0 and x=1:
For n=3, between x=1 and x=2:
For n=-2, between x=1 and x=2:
CONJECTURE: For a curve of the form, between x=a and x=b, a<b, the ratio A:B of the volumes of revolution about the x-axis defined below is equal to 2n.
A: region bounded by the y-axis, the curve,, and .
B: region bounded by the x=axis, the curve, x=a, x=b.
PROOF: We proceed through the same process as for the individual examples above.
QED
We can now try a similar process for revolution about the y-axis. The limitations of both proofs will be discussed once this has been done.
For n=2, between x=0 and x=1:
For n=2, between x=1 and x=2:
For n=3, between x=0 and x=1:
CONJECTURE: For a curve of the form, between x=a and x=b, a<b, the ratio A:B of the volumes of revolution about the y-axis defined below is equal to .
A: region bounded by the y-axis, the curve,, and .
B: region bounded by the x=axis, the curve, x=a, x=b.
PROOF: We proceed through the same process as for the individual examples above.
QED
The restrictions for this pattern follow similar lines to those for the areas defined above, and the restrictions detailed above still hold. In particular, attention must be paid to values of n<1, which result in cases where a<b but an>bn, so that the formula above for removing volumes from cylinders will sometimes be the ‘wrong way around’. This occurs because the formula used in the proof is based on the arrangement of volumes shown in the diagram on page 11.
In addition, since 2n+1 occurs as a denominator in the first, and 2+n in the second, n must not equal or -2.
However, with these restrictions in place, the formula is general and the rule can be said to hold for all .