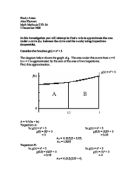
Method 3:
The final third method involves solving for x and finding the area in terms of y.
Now that the areas of both A and B have been calculated, a ratio can be obtained by dividing A by B.
The ratio of A to B is 2:1.
Next, I will find the ratio of A to B in other functions that follow the model of and where n is a positive integer. The area will remain bounded by the curve as well as the x-axis from x=0 to x=1. Throughout the rest of the investigation will be using the method 2 to solve the area of A.
I will use the second method to find the area for the first few values of n following 2.
The next equation I will find the ratio for is.
Area of B
Area of A
Ratio of A to B
Graph of
The ratio for is.
Area of B
Area of A
Ratio of A to B
The ratio of
Area of B
Area of A
Ratio of A to B
Now I will find the ratio of several other random positive rational integers.
The ratio of
Area of B
Area of A
Ratio of A to B
The ratio of
Area of B
Area of A
Ratio of A to B
The ratio of
Area of B
Area of A
Ratio of A to B
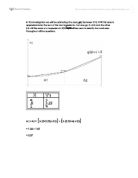
I will find other relationships between A and B in other functions using a graphing utility and replacing n with other positive integers. The results of the calculations done above and those done in the graphing utility are displayed in the table below. Each value of n investigated has the are of A and the area of B and then the ratio between A and B.
After analyzing the table, I’ve noticed a pattern correlating between n and the ratio between A and B. From this I will infer that the value of n is equal to the ratio. However, to make my conjecture valid I will have to test it with values of n other than positive integers. My next step will be to investigate the relation between A and B when n is a negative integer.
The first equation I will test with a negative integer for n is .
Area of B
Area of A
The area for both A and B calculate out to be undefined. In order to get a better understanding of the situation, I will graph the area of B and the area of A separately.
Graph With area of B shaded
This graph shows how the area of B is infinite since the function will go on into infinity and never touches the y axis.
Graph of With the Area of A shaded
This graph shows that the area of A is also infinite like that of B. This supports the calculations done earlier because it shows that because the areas of both are undefined, they are infinite.
This means that the conjecture I originally made does not apply when n is equal to a negative integer. In order to find out if there anymore exceptions to my conjecture I will investigate the relationship between A and B for rational values of n.
First, I will begin with . I will once again see if there is a relationship between A and B.
Area of B
Area of A
Ratio of A to B
Graph of
This shows that my conjecture still does apply to rational positive values of n.
Next I will test the conjecture to a negative rational value.
Area of B
Area of A
Ratio of A to B
Graph of With B shaded
Graph of With A shaded
For the function , there is a disagreement between the graphs and the calculations. For the area of A and B I got integers, actual numbers. Also, through the calculations, the ratio between A and B is Which was the entail value of n. The graphs on the other hand shows that the area of both are infinite. My knowledge of calculus isn’t sufficient enough to explain why this disagreement between the calculations and the graphs exists.
The only way to make the calculations give me an undefined area, as they did for the other negative integers would be by making n a fraction that is greater than 1.
For example I will use the function
Area of B
Area of A
Graph of With B shaded
Graph of With A shaded
In this case however, we would not be able to get a ratio but the areas would be undefined.
The next step in my investigation will be to test weather my conjecture will apply to other functions in which b is any real number greater than zero.
First, I will begin with and a will remain 0 and b will be 5. This also means that f(b)=25.
Area of B
Area of A
Ratio of A to B
Graph of
Next I will investigate in which n is a real irrational number. Here I will make b to be 8. This change will also make
Area of B
Area of A
Ratio of A to B
Graph of
According to the calculations and the graphs, we can see that the original conjecture still applies to real numbers, even irrational real numbers.
To further extend my conjecture, I will find the relationship between a and b in several other functions in which a will be greater to zero but less than b.
To further extend my conjecture, I will find the relationship between a and b in several other functions in which a will be greater to zero but less than b.
First, I will explore the function . Here a will be 2 and b will be 5.
Area of B
Since the formula that I have been using before measured the entire area under the curve, for this function it will be necessary to make some adjustments since I am not including the area under f(a). A revised version of the formula used can be seen below.
Area of A
Ratio of A to B When a=2 and b=5
Graph of Where a=2 and b=5
I will also find the relationship between A and B in the function When a=4 and b=8.
Ratio of A to B When a=4 and b=8
Graph of When a=4 and b=8
My original conjecture applies to these types of area because the a and b will make a proportion since the ratio is still equal to n.
Finally I will prove my conjecture mathematically. The area of A will remain that space surrounded by the y-axis, the variation of the by from x=a to x= b.
Now, I will prove that the ratio between A and B is equal to n.
I will use actual numbers to plug into the equation and confirm that works.
First example:
when a=4 and b= 8
Second example:
When a=2 and b=4
Third example:
When a=1 and b=2
All of the equations above proved my conjecture right.
In total, from the entire investigation I can make the following reasoning:
When a curve follows the model of , the relationship between A (the area surrounded by the curve, the y-axis and the lines y=f(a) and y=f(b)) and B (the area surrounded by the curve, the x-axis and the lines x=a and x=b) will be that the ratio of A to B will be equal to the value of n. This applies to positive integers, positive rational, and real numbers(including irrational). Limitations to this however are negative values of n for which I conclude the areas for both A and B will be undefined or infinite.