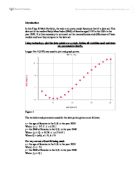
There are a few functions that may model the behaviour of the data points. One of these is the quintic function. This function was chosen because within the set parameters it models the points with little error.
Using LP3:
Therefore according to LP3, the quintic function:
y = 9.7871×10-07x5 + 4.34275 ×10-05x4 - 0.00726582x3 + 0.206889x2 - 1.59147x + 18.8139
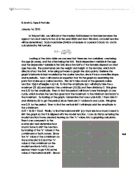
On a new set of axes, draw your model function and the original graph. Comment on any differences. Refine your model if necessary.
As shown, there is very little error, as the RMSE value is close to zero. If a table was created to show the difference in the point of the actual BMI with the BMI on the curve, it would be:
Use technology to find another function that models the data. On a new set of axes, draw your model function and the function you found using technology. Comment on any differences.
Using LP3, the Gaussian function was used to model the data.
Gaussian function: y = -6.933e
As shown, there is very little error, as the RMSE value is close to zero. Therefore, the differences between the curve values and actual BMI values are very small.
Use your model to estimate the BMI of a 30-year-old woman in the U.S. Discuss the reasonableness of your answer.
The quintic model’s x-axis was change in LP3 to include the age of 30. The graph was then set to “interpolate” to generate an answer on the quintic function for x = 30.
Therefore the BMI of a 30 year old woman is 20.05. This is slightly unreasonable because it is less than the BMI of a 16 year-old according to the data. As a person ages, there height will only slightly change, while weight increases (assuming there is a lack of exercise when older). Since ms is in the denominator, and weight is in the numerator of BMI, the BMI would increase. Although the quintic function matches the data with the slightest of error, the reasonableness of the function in response to the assumptions made does not correspond.
However, if the BMI of a 30 year old female was taken from the Gaussian function:
Therefore the BMI of a 30 year old woman is 22.15. This is more reasonable because there are been an increase from the BMI values of ages less than 30. However, The graph plateaus at the BMI value of 22.15, which is also unreasonable because it is highly unlikely a 30 year old woman’s BMI is the same as an 80 year old’s BMI.
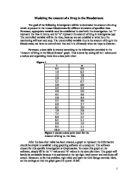
Use the Internet to find BMI values for females from another country. Does your model also fit this data? If not, what changes would you need to make? Discuss any limitations to your model.
According to data from the World Health Organization (see works cited for citation), the mean BMI were calculated and grouped into regions and subregions. The data collected was from EUR-B which consists of data from Bulgaria, Poland, Slovakia and Turkey. Ages 5-17 were collected individually.
When graphed against the quintic model:
This model fits the data, although not as accurately as with the U.S. data, However, the Root Mean Squared values are both fairly close to zero (0.04725 and 0.3136). The same limitations apply to this data as the US data.
When graphed against the Gaussian model:
This model fits the data, although not as accurately as with the U.S. data, However, the Root Mean Squared values are both fairly close to zero (0.08161 and 0.2827). The same limitations apply to this data as the US data,
Conclusion
It was found that many model functions may fit a certain data set. However, when it comes to choosing the right function to represent it, one must explore the context in which the data set is given. Since the data set was the BMI vs Age, one needed to use reason in determining a suitable model function, and deduce any limitations. With such little data given, limitations can be found everywhere. If there were, for example, more ages and median BMIs, there would be a better fitting function available than the ones mentioned. It is important to note that through mathematical analysis and the use of reason the best answer can be reached.
Works Cited
James, W. Philip T. "Comparative quantification of health risks." 14 April 2003. World Health Organization. 16 December 2008 <http://www.who.int/publications/cra/chapters/volume1/0497-0596.pdf>.