- x=5 is the line of symmetry as
x= = 5
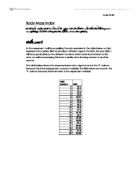
Using data from the graph, I let the x value be 3 and therefore, the y value is 15.7,
-
15.7 = a(3)2 + b(3)2 + c
15.7 = 9a + 3b + c
Using another point on the graph, I let the x value be 17 and therefore, the y value is 20.85
-
20.85 = a(17)2 + b(17)2 + c
20.85 = 289a + 17b + c
Now that I have 3 equations, I can use simultaneous equations to solve the values of a, b and c.
Substitute (1) into (2)
- 15.7 = 9a + 3(-10a) + c
15.7 = -21a + c
Substitute (1) into (3)
- 20.85 = 289a + 17(-10a) + c
20.85 = 289a – 170a + c
20.85 = 119a + c
(5) – (4)
5.15 = 140a
a= = 0.0368 (6)
Substitute (6) into (1)
b= -10a = -10 x 0.0368 = 0.368
Substitute (6) into (5)
20.85 = 119(0.0368) + c
c= 16.47
Therefore, the quadratic equation is
y= 0.368x2 – 0.368x + 16.47
- On a new set of axis, draw your model function and the original graph. Comment on any differences. Refine your model if necessary.
From the equation y= 0.368x2 – 0.368x + 16.47, I put all the points in a table with the same x axis but using the new y values.
I then plot both the original graph and my model function on the same set of axis so I can compare the values.
Blue line: Original graph
Red Line: Model function
From the graph above, it seems that the model function is quite similar to the Original graph, but is not close enough. This is because the y value of the original function tends to decrease as the x moves towards 20. The y value of the modelled function however, tends to increase greater as the x value moves towards 20. Therefore, the original function is seems to be closer to a cubic polynomial rather than a quadratic equation.
- Use technology to find another function that models the data. On a new set of axes, draw your model functions you found using technology. Comment on any differences.
Before I choose another function that models the data, I have a few functions in mind. I am thinking of choosing either cubic, quartic or quintric polynomials. In order to see which function models the data the best, I will be using the RMSE or the root means square error. This is a measure of the difference between the values predicted by a model and the actual values from the data. RMSE is a good way to indicate the accuracy and to see how close the modelled data is compared to the original data.
The first function I will use is the cubic function.
The equation of this function can be calculated from the graph
y= -0.0041x3 + 0.154x2 -1.28x + 18.27
with an RMSE of 0.07864, which is very accurate.
The second function I will use is the quartic function
The equation of this function can be calculated from the graph
y= 9.73E-005x4 – 0.00835x3 + 0.217x2 – 1.630x + 18.86
with an RMSE of 0.04564, which is even more accurate than the cubic function.
The last function I will use is the quintric function.
The equation of this function can be calculated from the graph
y= 9.79E-007x5 + 4.34E-005x4 – 0.00727x3 + 0.207x2 – 1.59x + 18.81
with an RMSE of 0.04725, which is also more accurate than the cubic function, but not as accurate as the quartic function.
The quartic function is the most accurate so I will use this graph for the following question. Although the quartic graph is the most accurate, it is only a best fit for the data provided (age 2 – 20). Therefore, there may be errors when predicting preceding values outside the data provided.
- Use your model to estimate the BMI of a 30-year-old woman in the US. Discuss the reasonableness of your answer.
From the previous question, the quartic function is the closest to the original data compared to all the other functions I looked at. Therefore, I will start off by using the quartic function.
If I zoom out, the graph would look like
The coordinates for 30 yr old women are (30, 20.06)
This means that the BMI for 30 year old women is 20.06
This value is unreasonable because the BMI of 30 yr old women resembles that of 15 – 16 yr old girls.
If the BMI is calculated by taking the weight and dividing it by the square of the height, the either the height of 30 yr old women in the US increases a lot or there is a sudden decrease in their weight. Due to the fact that girls reach maturity and finish growth at the age of around 14, it is impossible to have this data and therefore, the quartic graph does not fit for the BMI for women over 30.
Therefore, I would need to find another function which shows a realistic BMI for 30 year old women in the US.
I found that the Gaussian function shows a more realistic trend for the BMI of women ages 20-30 compared to the quartic function.
The Gaussian graph above shows that the BMI of 30 year old women is 22.21 which are slightly higher than the BMI of 20 year old women which is 21.65. This graph is more reasonable compared to the quartic graph because it is reasonable to assume that the BMI of 30 year old women is slightly higher than 20 year old women. Therefore, I decided that the Gaussian graph is reasonable to estimate the BMI of 30 year old women.
- Use the internet to find BMI data for females from another country. Does your model also fit this data? If not, what change would you need to make? Discuss any limitations to your model.
I found a table showing the BMI of Shaanxi (province in china) women age between 1-18. To compare this data with my model, I would need to plot these values in a graph.
Source:
I will use the 50th percentile of rural girls as it is the average.
I would need to plot this data on the same axis with my model to see if it fits.
The dotted line represents the BMI of Chinese women and the continuous line represents my model.
The limitation to the data of the BMI of Chinese women is that the age range. This decreases the accuracy of the graph because I don’t know the exact BMI of women above 18 years old and therefore, I am forced to make estimation.
From the graph, it can be seen that my model does not fit this new data and therefore I would have to change my model.
I tried to remodel the quartic function again as it best fits this new data.
The dotted line shows the BMI of Chinese women and the continuous line shows the quartic polynomial y= -0.0004x4 + 0.0131x3-0.0635x2-0.4129x+16.846
Conclusion
From looking at all these functions modelled, the quartic polynomial best fits the graph of Chinese women’s BMI.
After completing the task, I found a flaw to the quartic polynomial as it is only reasonable up to the age of 20. After that, the graph immediately descends. This is highly unreasonable as a women’s BMI at the age of 25 is 15.4. However, due to the insufficient data provided for the BMI of Chinese women, I have tried every single function I can find and there is still no solution to the issue. This may be resolved by using more data.
However, the quartic graph, is the most accurate compared to the Gaussian, sine, cubic and quintric graph for the BMI of Chinese women between the age of 1 to 18 and therefore, I will not make any changes but keep this modelled function for this data.