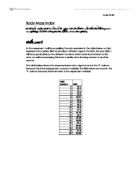
We are going to start with 10 trapeziums:
Autograph gives us a result of 3.335 for the graph of using 10 trapeziums. This is already a bit smaller/more accurate.
We are going to continue with 25 trapeziums:
Autograph gives us a result of 3.334.
50 trapeziums:
Autograph gives us a result of 3.333:
100 trapeziums:
Autograph gives us a result of 3.333
Looking at the different results we notice that the way how the number of trapeziums affects the accuracy of the measurement is disexponential. The more trapeziums we use, the more accurate our results are. But the more you increase the number of trapeziums, the less is the increase in accuracy. This is shown on the following diagram.
Development of the general expression for the area under any curve y=f(x) from x=a to x=b using n trapeziums
To find a general expression we can start off with the expression for the approximate area under a curve using five trapeziums:
First of all we can apply the knowledge that we already have to replace the variable h by creating.
This formula assumes that a and b are already calculated y-values, but since they shall be variables for x-values as stated in the heading we are going to name them f(a) and f(b).
Now we need a replacement for the variable c. To show what this variable consists of we are going to use the example of 5 trapeziums where the following expressions for the different heights (y-values) were used:
g(0), g(0.2), g(0.4), g(0.6), g(0.8), g(1)
Taking the example of g(0.2) we see that it consists of a+h since
0+0.2=0.2.
Taking the example of g(0.4) we see that it consists of
h(u-1)+a. The variable u in this case determines which height it is. That means, using again the example g(0.4), that this expression shows the 3rd height. Hence, u=3). The expression for c would then be f(h(u-1)+a)
Hence, g(0.4)=f(0.2(3-1)+0)
g(0.6)=f(0.2(4-1)+0)
…
One might think one had to write f(h(u-1)+a) in order to express f(a) or f(b), the first and last height, but in fact it’s okay to write f(a). We will clarify this at the example of 5 trapeziums again. In this particular case, we have a=0, b=1, h=0.2 and u=1(since g(a) is the first height). Therefore:
g(0.2(1-1)+0)=g(0)=g(a)
For g(b), we get the same result:
g(0.2(6-1)+0)=g(1)=g(b)
Inserting the values we get of course 1 again. Since 0=a, we can write g(a) and since 1=b, we can include g(b) because we get the same result as well as after inserting the values. This makes our formula simpler.
Concluding we can state the general expression for any curve y=f(x) being:
We are now going to consider the areas under the curves y1, y2 and y3 using the general statement with eight trapeziums.
For every curve we can state that:
a=1;
b=3;
n=8;
We can insert those values into our general formula:
In order to calculate the areas under the curves of the three functions we should be able to use this formula.
We’ll start with the function
First we have to calculate the y-values in order to get the heights of the trapeziums by inserting the x-values into the formula.
Now, we put those values into the general formula in order to find the approximate area under the curve:
Inserting the values gives us the following:
To solve the value in the bracket, we’ll use the GDC giving
A=0.25(7.92)
A=1.98
We’ll continue with the function
First we have to calculate the y-values in order to get the heights of the trapeziums by inserting the x-values into the formula.
Now, we put those values into the general formula in order to find the approximate area under the curve :
Inserting the values gives us the following:
To solve the value in the bracket, we’ll use the GDC
A=0.25(32.98)
A=8.245
We will continue with the function
First we have to calculate the y-values in order to get the heights of the trapeziums by inserting the x-values into the formula.
Now, we put those values into the general formula in order to find the approximate area under the curve :
Inserting the values gives us the following:
To solve the value in the bracket, we’ll use the GDC
A= 0.25(18.75)
A= 4.69
We are now trying to find the area under the curves of the last three functions using integration:
We’ll start with finding
= Now we can exclude from the integration.
= = = =
Using the calculator at this point gives us the following solution
= 1.98 units^2 (3sf)
This solution matches with the solution using trapeziums. We can therefore state that the trapeziums give a quite accurate solution if we use enough trapeziums.
We’ll continue with finding
Since integration seems not to be possible to solve with our current knowledge we will use the calculator to solve it.
Below we can see the way to calculate the integration of using the GDC.
Press MENU
-> Press “Right Arrow” 4 times
(Opening the menu GRAPH)
->Press EXE
-> Type (9x)/(((x)+9))
-> Press F6 to draw the graph
->Press SHIFT,
Then F5,
Then F6,
Then F3
-> Press “Right Arrow” 10 times
-> Press EXE
(Confirming the lower x value, a)
-> Press “Right Arrow” 20 times
-> Press EXE
(Confirming the upper x value, b)
Now we can see a graph with a shaded area, the area under the curve, between x=a and x=b
->The calculator gives us the answer:
A = 8.25973122425 units^2 or
A = 8.26 (3sf)
The answer using the trapezium was A=2.245 units^2, converting it to 3sf gives 2.25 which differs only 0.01 units^2 from the answer using the GDC for integration.
We’ll now continue with finding
= = =
This solution differs 0.2 units^2 from the solution using 8 trapeziums which was 4.69 units^2. This is still quite accurate but not as accurate as the two ones before. As we see in this graph there are some points where there is too much area over or too less area under the curve taken into account by the trapeziums. But why is it still that accurate?-Because in this case the inaccuracies nearly offset each other.
Furthermore, if you look at the three graphs one after another you can see a development.
We can see that the parts of the curves calculated for the area under the curve differ a lot from each other. On the first graph this part is nearly straight; hence changing the amount of trapeziums shouldn’t change the accuracy much.
On the next graph, only 2 trapeziums are used for
Using two trapeziums autograph gives a result of 1.97 units^2 which differs 0.01 units^2 from the result using integration, 1.98 units^2. This shows that if we are calculating the area under quite straight lines, accurate results can also be got using few trapeziums.
We will clarify this on the graph of y=x, a straight line, we’ll only use one trapezium:
Autograph gives us 4 units^2 as a result for the area under the curve. This exactly matches the result using integration, 4. Therefore, if we are calculating the area under a straight line, one trapezium is enough.
On the second graph, , the calculated part lies directly on a maximum turning point; therefore using less trapeziums should affect the accuracy quite a lot since the line is not straight.
On the next graph, only two trapeziums are used for
Using two trapeziums autograph gives a result of 8.039 units^2 which differs 0.221 units^ from the result using integration, 8.26. This shows that when we are calculating the area under a turning point the result becomes quite inaccurate using less trapeziums.
As another example for a graph with one SP we are going to use the graph y=x^2:
We are calculating the area under the curve from x=-2 to x=2.
The result using 8 trapeziums is A=5.5 units^2. The result using integration is A=5.333…; we can see here that it’s already quite inaccurate to use 8 trapeziums. It should get even worse using less trapeziums.
Now we are going to use two trapeziums to approximate the area.
Using two trapeziums, 8units^2 is the result we get for the area under the curve. The difference to the result using integration is more than 2.5. Here we can see that our general formula can fail quite badly if the wrong number of trapeziums is used.
We would have to use more trapeziums to get an accurate result.
Now we are going to use 100 trapeziums:
The result we get using 100 trapeziums is A=5.334 units^2. This result can be described as accurate enough. But still, it’s going to take way to much some time to calculate the area with our general formula since we would have 101 heights to calculate.
On the third graph, , the calculated part is including two turning points, a maximum and a minimum.
On the following graph, only two trapeziums are used for
Using two trapeziums autograph gives a result of 5 units ^2 which differs 0.33 from the result using integration, 4.67 units^2 . This shows us that calculating the area under even two turning points the result becomes very inaccurate using les trapeziums.
To clarify we are going to use the example of the curve y=10sinx.
We are going to calculate the area under the curve between x=0 and x=10, therefore we include 3 SV’s into our calculation. First we are going to approximate the area using two trapeziums:
The result for the area using two trapeziums is -61.55 , whereas the result using integration (GDC) is A=18.39 units^2. Here we can see even more clearly that using to few trapeziums can result in a totally wrong answer.
Now we are going to try to approximate the area under the curve using 20 trapeziums.
The result using 20 trapeziums is 18.01units^2 which still differs about 0.4 units^2 from the result using integration. We can see that the more SV’s are included in the calculation, the more trapeziums are needed to get an accurate result. We would need at least 150 trapeziums to get the accurate result as shown in the next graph:
Furthermore it’s not possible to use the trapezium rule for the equation y=x^-1
If we want to calculate the area under the curve from for example x=-1 to x=1 the result is invalid. This is because the two parts of the curve never touch x=0; they get closer and closer but never touch it. Therefore it’s not possible to calculate the area under the curve of y=x^-1.
Concluding we can say that the more turning points are included in our calculation of the area under a curve the more trapeziums are needed to give a decent approximation. That means that our general formula can give a very inaccurate, even a completely false result if it’s used in the wrong way and too few trapeziums are used. Therefore, the formula always has to be adapted at the shape of the graph; if the graph is a straight line, it’s sufficient to use only one trapezium. But if the area under the curve includes many stationary values, many trapeziums are necessary to produce an accurate approximation as seen in the last example.
In the end we can state that the accuracy of our general formula depends on the shape of the graph. However even quite complex curves with more than one turning point can be solved accurately using enough trapeziums; the more trapeziums we use the more accurate result we get. But nevertheless, it takes way too much time to calculate 100 or even more trapeziums with our formula. Therefore we can say that our formula is not suitable for the calculation of the area of curves with more than two stationary values.