Table 1
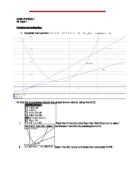
Using Graphamatica, I have plotted and drawn this Graph of n vs. Nn
Scale
X axis – 1 step – 0.5 units
Y axis – 1 step – 20 units
Relationship between n and Number of sides:
We can see from the table on the left that it is a geometric progression since every successive term after the 1st term is being multiplied by the common ratio 4.
We can confirm this common ratio by taking two values from the table on the left.
Ex. 1 N1 = 3 and N2 = 12
Ex. 2 N2 = 12 and N3 = 48
General formula for Nn
The general formula can be verified by putting in values from the table
Using Graphamatica, I have plotted and drawn this Graph of n vs. Ln
Scale
X-axis – 1 step = 0.5 units
Y-axis – 1 step = 0.1 units
Relationship between n and Length of each side:
We can see from the table on the right that it is a geometric progression since every successive term after the 1st term is being multiplied by the common ratio. .
We can confirm this common ratio by taking two values from the table on the left.
Ex. 1 L1 = 1 and L2 =
Ex. 2 L2 = and L3 =
General formula for Ln
The general formula can be verified by putting in values from the table
Using Graphamatica, I have plotted and drawn this Graph of n vs. Pn
Scale
X-axis – 1 step = 0.5 units
Y-axis – 1 step = 1 unit
Relationship between n and Perimeter of the shape:
We can see from the table on the right that it is a geometric progression since every successive term after the 1st term is being multiplied by the common ratio. .
General formula for Pn
We can confirm this common ratio by taking two values from the table on the left.
Ex. 1 P1 = 3 and P2 = 4
Ex. 2 L2 = 4 and L3 =
The general formula can be verified by putting in values from the table
Using Graphamatica, I have plotted and drawn this Graph of n vs. Pn
Scale
X-axis – 1 step = 0.5units
Y-axis – 1 step = 0.1 units
Relationship between n and Area of the shape:
We can see from the table on the left we can clearly see that the initial number a is . Now since the denominator goes from 4 to 3 and then goes on increasing in odd powers of three I hypothesised the common ratio to be which turned out to be correct. After subtracting and dividing the answers by the remainder was and so I multiplied it by the same factor.
General formula for An
The general formula can be verified by putting in values from the table.
Stage 4
For the diagram above I have used a software called Dr. Bill’s software of the Von Koch snowflake simulation which I found online.
To investigate what happens at stage four, we will have to apply all of the above equations and substitute n as 4. we will have to substitute in these for
This is how one side of the Koch snowflake would look at stage 4. I have used another free online software in order to simulate this.
Verifying the values using the diagrams:
Number of sides:
From the diagrams above we can see that each successive iteration has transformed each side into four different sides and of a smaller length.
This proves my prediction for Nn =
Since
is true,
Length of each side:
We can see that each side of the equilateral in the Koch snowflake gets divided into three parts. The middle third of the side is used as a base for another equilateral triangle having the same side length as the base.
The next shape would have a side length which would be a third of a third,
=
Here we can see a pattern as,
Shape 1 – 1
Shape2 -
Shape 3 -
And so I can say that my prediction about the relationship between length of side Ln and the stage n is true,
is true,
Perimeter of each shape:
The perimeter of the first shape would be = 1 x 1 = 1
While the perimeter of the second shape would be =
Since a triangle has three side we can say that perimeter of the triangle would be the perimeter of one side multiplied by three
shape 1 =
For the second shape, the perimeter would be,
We can see a pattern from this which clearly indicates that my prediction about the relationship of n and Pn is true,
is true,
Part 5.
To obtain the above table, various formulas were used in the spreadsheet software (Office ‘07).
These are as following: -
- A3: f(x)= A2+1
-
B2: f(x)
-
C2: f(x)=
- D2: f(x)=B2 x C2
- E2: f(x)=0.5*SIN(60*PI()/180)] (=√3/4) (fixed)
- E3: f(x)=E2 +(B2*(0.5)*(C3^2)*SIN(60*PI()/180))
Part 6
The geometric pattern of the perimeter of the shape is a divergent series as the common ratio is > 1. Hence the perimeter at each stage increases exponentially. This is also proved by the graph.
From the graph we cqn see that as,
Area of the shape
Formula
For the geometric progression in the formula above we can see that the common ratio is lesser than 1 and so this can be called a convergent series. When n increases towards ∞ , becomes so small a value that the highlighted part of the equation becomes equal to one.
Part 7
The following iterative formula was derived: -
We can now substitute the general formula derived in this equation: -
To prove this equation by induction...
Step 1: Assume statement true for n=1,
Therefore, the statement is proven true for n=1.
Step 2: Assume statement true for n=k,
We have already proven the statement true for n=1 and since , we can say the statement must be true for n=2, 3, 4,... n.