I will now go on to find out how the increase in trapeziums can affect the number I will receive from calculating the area. I will use autograph to draw out my graphs, and I will use excel to help me calculate the area of each trapezium.
To conclude the area underneath the curve got more accurate with more trapeziums added into the graph. And as stated, it is due to the over-estimation of the area with the trapeziums, but adding more within the graph reduces that over estimation.
I have noticed there is a relationship between the number of trapeziums within the graph and the areas that they produce. The table below will show the differences in the areas that each number of trapeziums produces.
When we take the total difference and square it, then add the two of the same squared differences.
Therefore by finding the potential “total difference” and have the total area be subtracted from the found total difference, we will be able to find the next total area.
Part 2
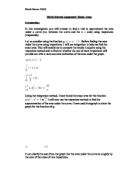
So the very basic idea behind finding the area underneath the line is through finding to how many trapeziums to separate the X axis into, which is deciding upon how much height each section will have. Then finding the trapeziums area through doing the . Therefore for example when we are trying to find the area with 5 trapeziums the formula will be:
But when we have this equation in terms of x we get:
Therefore it’s basically just plugging in the numbers into the equation above, for example for you will have to find that length therefore you plug the 0.2 into the given equation, for this example it’s,
when we find the number of that X co-ordinate we can then plug it into the equation, and repeat the process with the other lengths. But his is not a general formula, where I will have to change the to and the different x axis sides, where the will be used, which will give me this formula:
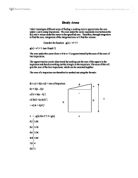
To simplify this equation I will simplify one part of it as it correlates towards the rest, as to use that part as an example:
Therefore we are able to factorize this equation as ½ and h as repeated throughout the equation which will give us this:
This is still not a general explanation to the formula, as its still focused on one example, therefore to change this example so that it can be used with any number of trapeziums, we have to change the height as it has to correlate with the length of the x-axis and the number of times that x-axis will be split. Simply we are able to change h to where “b-a” will give us that length of the x-axis where they want to measure the area from, essentially the upper and the lower limits of their search for the area. “n” in that equation is the number of trapeziums that we want to use. Therefore together, “b-a” will be split by the number of trapeziums someone wants to use, therefore giving us height for the trapezium.
We can further simplify this equation into:
We are able to do this because, the numbers repeat twice throughout the equation apart from and though by doing so, we are just making it simpler to use, but to make it more general we will have to replace with therefore transforming the equation into this:
“…” in the formula is used as an uncertainty to how many trapeziums the user will have on his graph, therefore they have to continue depending adding until they reach the third last trapezium. Until reaching “n-1” where n is the number of trapeziums, this will allow the equation to substitute the uncertainty of the number of trapeziums within the equation. Though we are able to further simplify this equation to:
As is was simply
Therefore the most general formula is:
Consider the areas under the following three curves, from x=1 to x=3:
)
I used the GDC to find these areas, as it gave me a precise number to which I can compare the trapezium rule’s areas with the one calculated with a GDC using integration. Where I pressed Y=(placed in the equation), pressed graph, then second function trace, 7: , selected the lower limit to be 1, and the upper limit to be 3, then pressed enter to find the area between the limits.
The trapezium rule came to a close proximity with its approximations, with only small differences between the actual area, and the estimation. Though increasing the number of trapeziums used within the equation would increases the accuracy of the answers.
The scope and limitations:
The way that the rule will be limited or even not work is through the sin curves, as they fluctuate between the x-axis, the areas calculated will be difficult to do, as the sides of the graph go from a positive number, to a negative, therefore canceling each other out.
Another limitation to the rule is when the graph is irregular, and then the uncertainty or the over/underestimations from the rule will increase as the irregular curves create difficulty in estimating the curving parts of the graphs. Even through increasing the number of trapeziums within the graph the uncertainty is still great.
Another limitation is an isotope, where the line does not touch the axis, therefore makes it difficult to calculate the lengths for the trapeziums. Which makes it impossible to do, but if it’s done then the uncertainty for the area found will be high.