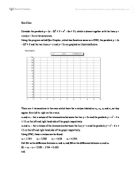
Graph : y = 1.01x 2 – 6x + 11
X1= 1.77
X2 = 2.41 SL = 2.41 – 1.77 = 0.64 SR = 6.15 – 4.52 = 1.63
X3 = 4.52 D = 0.99
X4 = 6.15
The graph : y = 1.02x 2 – 6x + 11
X1 = 1.78
X2 = 2.44 SL = 0.66 SR = 1.64
X3 = 4.43 D = 0.98
X4 = 6.07
The drawback of this conjecture : This conjecture does not work for any values of a greater than 1.12 as only one of the lines pass through the graph of y = ax2 + bx + c after this point, so we reach the second case of the conjecture.
CASE 2 ( only one line passes through the graph of y = ax2 + bx + c )
Note : This case is more complicated than the first conjecture.
Only one line passes through the graph when the value of a increases above 1.12. After this only the line y=2x passes through the graph of y=ax2+bx+c. How the conjecture was found out is shown below.
First the graph of y = 1.12x 2 – 6x + 11 was drawn. This graph is shown below.
Now the value of D of this graph can be found out
X1 = 1.86
X2 = 0 SL = -1.86 SR = 5.28
X3 = 0 D = 7.14
X4 = 5.28
To find a conjecture, more number of graphs must be drawn and more values of D must be found out. The value of a in the graphs were increased by a value of 0.01. The following are the graphs which were drawn.
Graph : y = 1.13x 2 – 6x + 11
The value of D for the above graph is 7.08
Graph : y = 1.14x 2 – 6x + 11
The value of D for the above graph is 7.02
Graph : y = 1.15x 2 – 6x + 11
The value of D for this particular graph is 6.96
This was repeated for 1.16 and the value of D was 6.9
Now the values of D can be written in the form of a table. The following is the table which shows the values of D.
From this a visible pattern can be observed. That is “ with every increase of 0.01 in the value of a, there is a decrease of 0.06 in the value of D “. So a formula can be made for the value of D. This is shown below. Take the graph 1.17x 2 – 6x + 11 for example.
-
First find the difference between the value of a and 1.12. This in this case is 0.05.
- Now find how many 0.01s are there in 0.05. This can be done by dividing it by 0.01.
- The answer is 5. Now multiply 5 and 0.06. The answer is 0.3.
- Now subtract 0.3 from 7.14. The answer is 6.84 which is the value of D.
-
From this we can write the formula 7.14 - ( (a-1.12)0.01×0.06)
But as we are not sure whether this conjecture holds for all the values of a till 1.46 where both the lines don’t intersect the graph, the conjecture must be tested. The following shows how the conjecture was tested.
The graph of y = 1.17x 2 – 6x + 11 was drawn. Then the value of D for this graph was found out. The graph is shown below.
The value of D was found in the following way.
X1 = 1.911
X2 = 0 D = 6.84
X3 = 0
X4 = 4.93
The conjecture holds true for this graph, but to make sure it holds for the rest of the values of a , the graph of y = 1.19x 2 – 6x + 11 was drawn. The graph is shown on next page.
The value of D for this graph was 6.72 and the conjecture holds true for this graph too. But the conjecture was further tested with the value of a as 1.20. This is shown in the next page.
Graph : y = 1.2x 2 – 6x + 11
The value of D for this graph was 6.66. This denotes that the conjecture does not hold for this graph and any other graphs from this point onwards, so a new conjecture has to be found out which would prove to be true for this graph too. To find this conjecture, a series of steps need to be taken.
A NEW CONJECTURE
As we have seen, the conjecture holds true for all the graphs till the value of a is 1.2. So a conjecture needs to be found that satisfies all the graphs from then on. So the first two conjectures can be kept the same, only the conjecture needs to be modified after the value of a crosses 1.2.
What can be understood from this ?
We can understand that there needs to be two conjectures to understand the patterns of the changes in the value of D when only one line intersects the graph.
So the general rule for any graph and it’s intersecting lines would be that after a certain point the conjecture changes and in this case that is 1.2.
HOW IS THE CONJECTURE FOUND OUT ?
First the graph of y = 1.21x 2 – 6x + 11 was drawn. After this many more graphs were drawn to find the conjecture. All these processes have been described below.
The graph : y = 1.21x 2 – 6x + 11
The value of D for this graph was 6.61 but according to conjecture it should have been 6.6 so there is a difference of 0.01.
The graph : y = 1.22x 2 – 6x + 11
The value of D for this graph is 6.56
The graph : y = 1.23x 2 – 6x + 11
The value of D for this graph was 6.5
This process was repeated for many other graphs including y = 1.23x 2 – 6x + 11, y = 1.24x 2 – 6x + 11 and y = 1.25x 2 – 6x + 11
The values of D for theses graphs are shown below.
If we have to find a pattern, we have to relate it with the values that D would have taken it we used the original conjecture. The value of a and the value that D would have taken if the original conjecture was used is shown below.
The below table shows the actual values and the value of D with original conjecture.
Now the values of conjecture oriented D and the original value of D can be compared.
First we will find the difference between the values of Ds
We can see that there is a sequence in the difference if we omit the first four values of a.
This can be proved if we take the value of D for the graph of y = 1.26x 2 – 6x + 11. The graph is shown below.
The value of D was 6.35 and the value of D if conjecture was used was 6.3. So there is a difference of 0.05. This makes it a sequence as the sequence becomes 0.02 ,0.03, 0.04, 0.05.
From this we can say that the original value of D can be found out by subtracting a specific number that forms part of a series from the value of D from the conjecture.
What does the above statement mean ?
There is a difference between the true value of D and the value found with the help of the conjecture.
If we observe the pattern of this difference, it forms a specific sequence. This value just needs to be subtracted from the original conjecture. How this is done is shown below.
Take the example of the graph y = 1.26x 2 – 6x + 11. According to the conjecture 7.14 - ( (a-1.12)0.01×0.06) the value of D would be 6.3. But the real value is 6.35. How can this be found out ?
From the point when a is 1.23, we find that the value of D increases in sequence. The sequence is written below.
0.02 0.03 0.04 0.05
If we find the nth term of this sequence, it would be 0.01n + 0.01. So we have to just know the term difference that is “n” to find out the difference between the real value of D and the conjecture value.
This is how the conjecture should be used .
First find the value of D according to the conjecture 7.14 - ( (a-1.12)0.01×0.06).Name it X
Now find the value of n with the following equation a-1.230.01. Name it y
Now use the formula x-((0.01y)+0.01). The real value of D would be got by the end of this operation.
In the above conjecture, the difference is just taken away from the conjecture based value of D.
An example is shown below.
Take the graph y = 1.27x 2 – 6x + 11 for example.
Find the value of D with the conjecture. The formula 7.14 - ( (a-1.12)0.01×0.06) is used.
So here is how it is done 7.14 - ( (1.27-1.12)0.01×0.06) = 6.24 = x
Now find y by the formula a-1.230.01 so here is how it is done 1.27-1.230.01 = 4 = y
Now use the formula x-((0.01y)+0.01) = 6.24 +((0.01y)+0.01) = 6.3.
To check the conjecture the graph is drawn and the formula of D is used to find the value of D. Below is the graph of y = 1.27x 2 – 6x + 11
From the graph the value of D is 6.3. Hence the conjecture holds true. But this conjecture must be tested further. This was done on the graph of y = 1.28x 2 – 6x + 11.
Below is the graph
The value of D from this graph is 6.25. Now the conjecture can be tested.
Here is how it was tested.
Find the value of D with the conjecture. The formula 7.14 - ( (a-1.12)0.01×0.06) is used.
So here is how it is done 7.14 - ( (1.28-1.12)0.01×0.06) = 6.18 = x
Now find y by the formula a-1.230.01 so here is how it is done 1.28-1.230.01 = 5 = y
Now use the formula x-((0.01y)+0.01) = 6.18 +((0.01*5)+0.01) = 6.25
HENCE THE CONJECTURE WORKS.
THE CONJECTURE AND INTERSECTING LINES
The two intersecting lines must be changed. These lines were turned to y = x+2 and y = 2x+2
Too check whether the conjecture works, first the graph of y = x 2 – 6x + 11 and y = 1.016x 2 – 6x + 11 was drawn. These graphs and the value of D for these graphs are shown below.
The value of D in this graph is 1. Now the graph of y = 1.01x 2 – 6x + 11 was drawn.
It is shown below.
The value of D for this graph is 0.98.
The conjecture was that for every increase of 0.01 there would be a decrease of a specific value in the value of D. In the above case, when “a” was increased by 0.01, the value of D reduced by 0.02. Hence the first art of the conjecture holds true.
Now to test the second part of the conjecture, again a graph was drawn. The graph was y = 1.37x 2 – 6x + 1. The graph is shown below.
The value of D for this graph was 5.84. To check whether the conjecture holds true for this graph, it was applied. The following shows how. The conjecture has to be modified as it is a different graph. Instead of 7.14 in the first formula, it is 5.84. Instead of 1.23 in the second formula, it is 1.37. These modifications were done and the conjecture was applied. The result was 5.83. So the conjecture holds true.
CONCLUSION
There are two different conjectures for different parts of the graph. One when both the lines intersect and one when only one line intersects. The conjectures have been explained. But the only problem is that when the intersecting lines change, some values in the equation must be changed.