The information above can be gathered in a table, as shown below.
From this data we can generate a graph using excel, in order to determine the type of sequence we are dealing with.
The graph above shows an exponential growth; hence, it is a quadratic sequence. Moreover, the figure to the right shows the features of a quadratic equations; therefore, in order to determine the general statement of the sequence, we can use a calculator as shown below.
Hence the formula for this sequence is y = .5x2 - .5x
In order to determine the validity of this statement I have tested the formula with 2, 5, and 7 transversals.
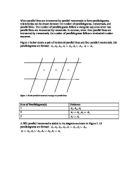
After obtaining the general formula of the relation between the number of transversals and the number of parallelograms, the task is to consider the number of parallelograms formed by three horizontal parallel lines intersected by parallel transversals. This is illustrated in figure 7 below.
At this point writing the set notation will not do any good, as the pattern is already established, and the process is highly inefficient.
When using the calculator to plot in these numbers, as shown previously, it gives the equation y = 1.5x2 - 1.5x. By using this equation I can now determine the number of parallelograms, with 5, 6 and 7 transversals without having to do the set notation or counting them. However, before I do this I need to test the equation:
By using the calculator, I found out that figure 10 with 5 transversals contains 30 parallelograms, figure 11 with 6 transversals contains 45 parallelograms, and figure 12 with 7 transversals contains 63 parallelograms.
It quickly becomes evident that as the number of transversals is kept at a constant of 2 parallel lines, the relationship between the number of horizontal lines and the number of parallelograms corresponds to the relationship between the number of transversals and the number of parallelograms. The only difference is that it is rotated; therefore, the general statement will be the same and so will the number of parallelograms. To illustrate the similarity, I have taken figure 2 from earlier and rotated it 90° CCW, as seen on the left. Since they share the same features this again is a quadratic sequence, which I have now demonstrated in the sequence below to the right.
From the previous results obtained when dealing with the relationship between the number of transversals and parallelograms, I can now conclude that the general statement of the relationship between the number of horizontal lines and parallelograms is y = .5x2 - .5x.
This relationship between the number of transversals and parallelograms and the number of horizontal lines and parallelograms in the two tables below. These results are to be extended to m horizontal parallel lines intersected by n parallel transversals; hence, I have labeled them m and n, in order to avoid confusion.
The above table shows how many parallelograms are generated when m is constant and n varies. The general statement of this as mentioned earlier is y = .5x2 - .5x, which can be factorized and expressed as y = x(x-1)/2, and since the parallel transversals are to be represented by the letter n the equation is therefore y = n(n-1)/2, where m is constant using this equation will make it easier to represent the overall general statement.
Since the general statement is the same when keeping n or the transversals at a constant of 2, as it is when keeping m as a constant of 2 y = m(m-1)/2.
The previous patterns were figured out by keeping either n or m constant, and the same results were given; hence, m and n have to be equal, and can be used as the length and width of the parallelogram as shown below. Because it integrates a specific area with a given range it demonstrates geometric properties, and when integrating the total you get several areas, which in this case are the parallelograms.
To get the area n(n-1) and m(m-1) are multiplied by each other; however, to get the separate parallelograms that exist within the main parallelogram, the answer obtained after multiplying n(n-1) by m(m-1) needs to be divided by 4, or as shown in figure 9 below.
Hence the general statement for the overall pattern is y = [n(n-1)/2] ∙ [m(m-1)/2] or y = [n(n-1) ∙ m(m-1)] / 4.
The values below were figured out by plotting in the equation in the spreadsheet (refer to attached spreadsheet)
A quadratic equation is a polynomial equation of the second degree; hence has specific rate patterns, which creates maximums and minimums. This particular pattern involves no negative x and y coordinates, because there is no such thing as negative lines, just like with a negative area, naturally also significant to this investigation. In conclusion to this statement both the domain and the range must be equal to or greater than zero.
Overall I think this investigation was an overall success, although it did take a lot longer than I has expected because of all the drawings and set notation. I did my best in including all the elements we were supposed to. Aside from this I feel like I was successful as I used numerous methods such as creating line regressions on my calculator, checking for quadratics by graphing, and validating my results when needed.