The value serves as a scaling factor for this function. By moving the value of up or down will result in a vertical stretch or vertical compression, respectively.
The value determines the function’s rate of growth or decay. The value can alter the function’s overall shape and behaviour.
The power functions of 2 points can be solved by using substitution. It can be done by first isolating the value, and then substitute the value in the second equation to solve for the value. After that, substitute the value in the first equation to get a value. This can be done by using any of the 2 points from the table. I will find the value for each of the values and the value which it is closest too. The reason I choose to substitute by using one value and another of its closest value is to avert a big variation in the final answer. At the end, taking the average of the values should get the model function.
WORK SHOWN: (All ANSWERS ARE ROUNDED TO 4 DECIMAL PLACES)
0.1
Right now, there are seven as well as seven. They are listed below.
In order to find the which is most appropriate for the model function, we must take the average of all of and divide it by the number of. However, the values and do not fit into the average range of -3 to -4. Thus, we will eliminate those 2 values for this calculation.
After finding the average of , we can use the same method to find the average of by substituting . Again, and does not fit in the range of the calculation, thus, we can omit those 2 values.
The equation which I came up with is
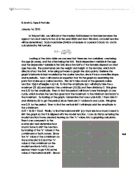
When this function is graphed with the original data points, it is apparent that the model functions, appeared in dark black, differs from the original data. As you can see in the following table, the model function misses point (6, 10) and (4.5 , 30) .The point at which it alternates the most is (4.5, 30). From my function, when. In order to improve the accuracy of this function, must go through a vertical compression. Consequently, the value must be decreased.
Human Tolerance to Horizontal G-Forces (Original Data vs. Model Function)
By using the trial and error method, it is clear that by decreasing the value of , the value would consequently decrease. However, the decreased value cannot be too large. This is because at point (9 , 3) it is already 2.5848; if the value is keep decreasing, the value would fluctuate from the original value at 3. At first I tried the value of at 6000; however, I can see that the when, the y value has significantly decreased, more than what I have hoped for. Thus, the addition of value is necessary. Next, I tried the value of at 6500. The value at have made a notable jump, but still not close enough to the original value of at. Finally, when I amplified the value to 6800, the . It also fits the needs of other points, as it shows that the margin of error is quite small among the bigger values, and the biggest margin of error is only -0.5765. In all, I believe that my final equation fits perfectly well with the data presented.
There are several clear implications that my model function has shown. First, I can see that as the Horizontal G-force increases, the amount of time that human can withstand it would decrease at a fixed rate of decay. In another word, as the G-force is approaching the positive infinity, the time that human can tolerance it would tend to zero. However, the time would never be 0, because it would be impossible to measure the value when time is 0. Thus, this graph is approaching, but never really intersecting the axis. Also, as the G-force decreases, the time in which human can tolerate will significantly increase as well. Also, I can take my model function right now and apply to other G-forces as well. I would expect that the function and graph of human reaction time vs. Other G-Force to be similar to my function and graph. The two relations would share the same base function . Other graphs would have the similarities as the is approaching positive infinity, the approaches zero. Furthermore, I believe that with a slight variation in the , my function can suit any other relations of human tolerance and G-force applied.
With the use of a regression program, Microsoft Excel, it can determine the power regression for this set of data. The model function which Microsoft Excel found is . When are graphed on the same axes, those 2 functions are basically identical. The only minor difference is that the regression function is a little more vertically compressed in comparison to my function.
Human Tolerance Vs. G-Force (Regression & Model Function)
The next table illustrates the tolerance of human beings to vertical G-forces. In this case, the value (+Gz) represents a positive acceleration in the vertical direction.
Human Tolerance to Vertical G-Force
As noted from above, human can tolerate a lot more “eyeballs-in” than “blood towards feet”. I expect that my first modeled function would not fit this set of data. As it is shown on the graph below, my modeled function does not entirely fit the new data. Even though this new data has the same basic function as my modeled function, . However, I can see that the in order to approach to the new set of data, my modeled function must be vertically compressed. Thus, I will have to lower the value of in order to fit into the new set of data.
By using the method of trial and error, I realized that the value of must be significantly smaller than the value I currently have, 6800. After several attempts, I have come to conclude at when below is the set of data with the new graph. is my revised function that fits well with this data.
There are several limitations of my modeled function. The most important limitation of the model is that it would not apply to every human being. This is because the amount of time human can tolerate has several factors other than the amount of g-force, others include: location of its application, the person’s health, age, and courage. This model’s accuracy will definitely take a fall after 11 g of horizontal G-force. This is because the amount of time a person can tolerate any amount of G-force over 11 g would fluctuates from one to the next. Because of other personal conditions involved, one person might tolerate 15 g of +Gx(g) for 0.3 minutes, and another person could only do it for 0.01 minutes. Thus, it is very difficult to give a clear estimate of the number of minutes a person can tolerate a horizontal G-force greater than 11g. Another limitation is the fact that it only measures when the G-Force is greater than 1. Thus, my function would not account for any time with the value below 0. This is another limitation as we cannot properly predict the values when the value is below 0.
In conclusion, I see that my model can be implied to all other relations between Human Tolerance time and G-Force. This is because all of those relationships would undergo decay, and it is certain that as G-Force is increasing, the tolerance time is decreasing. Thus, with the alternation of the value, I can find the functions of other relations between Tolerance Time and G-Force.