To control the variables, the positions of the apparatus should stay the same such as the speed level meter, the elastic band and the wall etc. the distance of the elastic band should be kept 12 cm away from the wall and same apparatus should be used. This could be done by using the materials from the same brand. The wall should be solid surface of the wall should have no holes so that there would be no difficulties for the sound level meter to get sound intensity.
The materials that would be required for the experiment is 1-elastic band, 1-wall,
1- Speed level meter, 1- thumb tack, 1– block of wood, 1 – table clamp. 1 - ruler
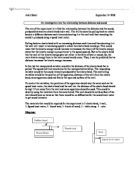
Diagram:
Procedure:
- Obtain all the materials and set it up as shown above in the diagram.
- Place the elastic band 12 cm away from the wall and keep it constant for the whole experiment.
- Place the speed level meter 1 cm away from the wall so that there would be no problem getting the sound. Set the speed level meter on high mode and keep the distance constant for the whole experiment.
- Stretch the rubber band 1 cm back and shoot it at the wall. Record the sound intensity.
- Repeat at least 3 times.
- Now stretch another 1 cm and record the sound intensity. Repeat this 3 times.
- Do this until the elastic band is stretched 10 cm. Make sure for each distance the rubber band is pulled at least three trials are taken.
- Repeat to confirm results
- Clean up
Data Collection and processing:
Distance of the rubber band from the wall: 12cm
Length of the rubber band: 3cm
Table #1: Raw data of the sound intensity recorded for each distance pulled back
Calculating Average sound
Avg.= (80 + 81 + 80) / 3 = 80.3 dB
Calculating errors for the average sound:
Eavg = (.05+0.05+0.05) /3 = 0.5
Presented data: Average sound recorded for each distance pulled back
Graph #1: Distance vs Sound Intensity:
Graph #1 plot the distance vs. sound intensity. The points are connected with a straight line indicating that the distance does affect the sound. Note for this graph that the sound intensity is zero when the distance of elastic band pulled back is 0. This graph can be proportioned so that it passes through zero and thus there is no statistic error although there is no need to do this for what is being found out in this investigation.
Calculations for the gradient of the graph:
m = (y2 – y1) / ( x2 – x1)
m = ( 102.7 – 80.3) units / ( 10 – 1)cm
m = 2.481 units/cm
Calculations for the minimum and the maximum gradients:
mmax = ( 104 – 81) units / ( 10 – 1) cm
mmax = ( 23) / (9) = 2.556 units of sound/cm
mmin = ( 101 – 79.667) units / ( 10 – 1) cm
mmin = (21.333) units / (9) cm
mmin = 2.370 units of sound/cm
Em = (2.556 - 2.370) units of sound /cm / 2 = 0.1
Slope = 2.5 + 0.1 units of sound/cm
Conclusion:
In this investigation, a sound level meter was used to determine the sound intensity for an elastic rubber band which hit the wall (whose position was at a distance of 12 cm away from the elastic band). The average of the sound intensity was calculated and thus the graph of Distance vs. sound intensity was made. Through the process listed at the beginning and the analysis throughout, it is found out that the sound increases by proportionality factor of about 2.5 + 0.1 units of sound/cm as the distance increases. This result is found from the slope of a liner graph which in this case tells the proportionality factor between sound and distance.
Evaluation:
The lab was a success. This can be seen form the linear relationship between distance and sound that was got from the data. But the slope varies about 0.1 units of sound/cm which is very small which means that there were some minor problems done during the experiment which caused the relative error to increase. One problem was the angle at which the elastic band was shot at the wall. The angle was not always parallel to the block of wood. This brought change in the direction of the elastic band hitting the wall which also resulted in the distance of the elastic band from the position of the sound level meter. Thus, the sound intensity recorded by sound level meter would not be accurate. Another problem was the external sound. The sound level was kept on high mode in the sound level meter which means that it was able to catch sound up to 150dB. The external sound for example, the noise of the people talking or the objects falling nearby can be captured by the sound level meter pretty well which can bring change in the data. Thus, the sound intensity recorded by the sound level meter in this case would not be right.
Improvements:
There were not any other errors caused by the apparatus. It was stable enough for the experiment. Therefore, there is no need to change the apparatus if this experiment would be done again. However, a protractor could be used to measure the angle so that there could be no problem with the angles in which the elastic band is shot at.
Another improvement would be to do this experiment in a quiet place such as a quiet room, so that there would not be any other sound captured by the sound level meter than the elastic band’s when hitting the wall.