The velocity of a uniformly accelerated body changes equally in equal interval of time. Keeping this statement in mind I will proceed with this experiment. As the body is starting from rest, the following equation will hold true:
Using simple algebra, we arrive at the following conclusion that the value of acceleration will be calculated out by the following equation:
We infer from this equation that as ‘s’ is the independent variable, it will be plotted on the x- axis of the graph and ‘t2’ on the y axis. Thus the final value will be calculated through the inverse of the graph.
- Ball of minute mass
- Rod which is grooved
- Stop watch (of least count 0.1s)
- Stopper for the ball
- Stand
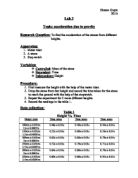
- Arrange the track with a wooden mount as shown in the figure above.
- Make marks on the tracks at equal intervals. As my track was 220cm long, I made marks every 20cm.
- Release the ball from the top and take readings of time for each successive mark.
- The temperature and pressure will be constant as the weather conditions are not changing.
- The mass of the ball is constant and the inclination will be kept steady as the experiment is being performed on a straight surface.
-
The calculated value of ‘a’ will be verified using the equation .
Before performing the equation, I checked my reaction time and found out that it was 0.1 seconds. As this corresponds to the least count of the stopwatch, it should not pose a problem. Also, the length of the ramp is 220cm and the height of the ramp is 90cm. These values will be useful in finding the values of sinӨ.
I took four readings of time taken at each value of length. Thus the readings were:
The error will be in the readings of thus we need to calculate the value of the error in t2. This will be double the error in t. The table showing the calculations of t2 from t is:
The final table showing the error bars is:
The table showing the plot final variables is:
From the graph it was calculated out that the slope of the graph is 0.984 units. Putting this into the equation formulated earlier for the acceleration, the acceleration is . Now on evaluating the value of acceleration from the equation , from the given data, it is seen that the value of g is 9.79ms-2, and the value of sinӨ is . Thus calculated out from the given test equation, which is taken to be the correct value, the value of acceleration is: . The experiment I conclude is fairly accurate, and I have achieved what I intended to study. The error in the graph is the difference between the errors of the maxima and the minima. The slope of the minima is 0.1017 and the slope of the maxima is 0.1018. Thus the difference being negligible we cannot account for the error numerically but we can say that it is present but in a very minute fraction.
On thoroughly evaluating the experiment I found I could have performed the experiment in a more accurate way. The modifications that I made which were not foreseen earlier were as follows:
- I had originally taken the ramp at a much higher inclination. It was inconvenient to take readings as the ball of unknown mass was accelerating too fast. So I reduced the inclination in order to increase the time period.
- To save time in data gathering on the shorter lengths, I placed a blockage after the respective lengths.
The possible areas of error could have been the following:
- The ball could not have been perfectly spherical which was assumed.
- My reactions in starting and stopping the stopwatch could have been delayed.
- The ramp may not have been perfectly smooth edged as is assumed. This may have caused a delay in the time.
This experiment holds a lot of value in the world outside the laboratory as it studies the constant acceleration of a body. This concept is used in the real world in many places such as acceleration of a car and many other phenomenons.
Physics Lab. Report No.5 : Constant Acceleration
Ankit Chowdhary Page