Boyle’s Law Lab
Aim: To investigate the relationship between Volume and Pressure of a fixed amount of gas
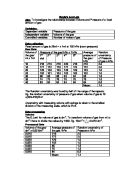
Variables:
Data collection
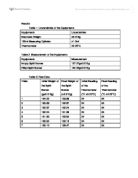
Fixed amount of gas is 25ml = ± 1ml at 102 kPa (room pressure)
Raw Data
The Random uncertainty was found by half of the range of the repeats.
Eg. the random uncertainty of pressure of gas when volume of gas is 10

=(220-216)/2=2
Uncertainty with measuring volume with syringe is taken to the smallest division of the measuring scale, which is ±1ml.
Data processing
Volume
The S.I.unit for volume of gas is dm3. To transform volume of gas from ml to dm3 I have to divide the values by 1000. Eg. 10cm3 ×=0.010 dm3.
Processed Data
Processed data graph
- The error bars for the random uncertainty for pressure is 1.4, which is so small that it is negligible in the graph.
- From the raw data graph, the line of best fit does not pass through ...
This is a preview of the whole essay
=(220-216)/2=2
Uncertainty with measuring volume with syringe is taken to the smallest division of the measuring scale, which is ±1ml.
Data processing
Volume
The S.I.unit for volume of gas is dm3. To transform volume of gas from ml to dm3 I have to divide the values by 1000. Eg. 10cm3 ×=0.010 dm3.
Processed Data
Processed data graph
- The error bars for the random uncertainty for pressure is 1.4, which is so small that it is negligible in the graph.
- From the raw data graph, the line of best fit does not pass through the origin and the graph has a negative gradient, which may suggest a positive linear relationship between V and .
Pressure
The raw data graph suggests a positive linear relationship between V and . To transform data from P to , simply divide 1 by the average pressure of gas at each volume of gas. Eg. at volume of gas of 0.010dm3 =
Final Data
Final graph
Random uncertainty for is 0.00010, which is so small that it is negligible in the graph.
Maximum gradient =
Minimum gradient =
Best-fit gradient = (0.40+0.34)/2 = 0.37 kPa-1 dm-3 ± 0.03 kPa-1 dm-3
Conclusion
The final graph show a linear relationship between V and and it is possible to draw a line through the origin within the uncertainty range, which suggest a inversely proportional relationship between volume and pressure of gas.
To calculate the theoretical gradient, I can use the ideal gas law PV=nRT or . Since the volume of 1 mole of ideal gas is 24.8L, the number of moles of gas in 25ml is mol. The universal gas constant R is 8.31 JK-1mol-1 and the temperature T is assumed to be a room temperature 298K. Therefore, the theoretical gradient is , which is just within the uncertainty range.
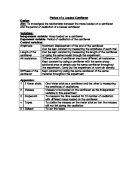
Evaluation
In reality, ideal gas doesn’t exist therefore
There are always uncertainties in measurements such as syringe and pressure sensor in this experiment. When the pressure reaches a very high or low pressure, our hands have to exert more strength to the plunger and the readings might not be steady. This may be the cause of the random uncertainties in the data collected. To improve, we can be a measure the pressure of a larger amount of gas so that the percentage uncertainty for volume of gas is lowered.
Also, we may have accidentally left gaps in the connector between the pressure sensor and the syringe and may cause gas to leak from the syringe when pressure is added to the gas. This may cause uncertainties to the pressure measured. For improvement, we can reconnect the syringe and pressure sensor each time we repeat a measurement and start again with 25ml of gas at room pressure. This can control the number of mole to be constant throughout the experiment.