Variables:
- Manipulated Variable: Mass Added
The mass added will be kept at a constant increase of 100g per trial; each 100g mass will be hooked on to the mass bottom of the previous mass.
-
Responding Variable: Spring Oscillation
The increase in the oscillation of the spring will be measured by a stationary meter stick placed vertically beside the spring placed in between the retort stand holder; each measurement taken will be measured to the nearest 0.05 cm and recorded on a data table.
- Controlled Variable(s): Environmental Conditions; Type of Mass Added;
The environmental conditions such as room temperature will be kept constant at around 20-24°C in order to keep the oscillation of the spring at a minimum, this would make a more accurate result of the spring constant. The mass added will be controlled by using the same mass of 100g (manufactured by one manufacturer with same color texture..etc.) for every trial, this would keep the uncertainty of the masses at a minimum and produce a better result for the spring constant.
Data Collection and Processing
- Data Table #1: Final Lab Results
*Initial Position Of Spring On Meter Stick: 60.00 cm
** The height of the spring increases after each mass is added, but a decrease in value will be shown on the ruler because the ruler is placed up side down for ease of reading.
- Data Table #2: Processed Data From Recorded Data
Data Processing for “Vertical Oscillation of Spring” in Data Table #2:
Mass of 0g: Initial Position at 60.00cm, Vertical Oscillation of 0.00cm
Mass of 100g:
Mass of 200g:
Mass of 300g:
Mass of 400g:
Mass of 500g:
Mass of 600g:
- Data Table #3: The Spring Constant
*Notable Measurement Conversion of Units: 1m=100cm; 1kg=1000g
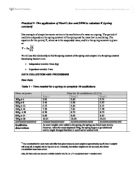
Propagation of Uncertainties:
Since = two uncertainties are involved in this experiment.
Uncertainty of Mass Scale ±0.2g = ±0.0002kg
Uncertainty of Meter Stick: ±0.05cm = ±0.0005m
Average Mass Added:
Average Oscillation of Spring:
Average Fg: Uncertainty is Related to Mass.
Percent Uncertainty for Mass Added:
Percent Uncertainty for Oscillation of Spring:
Final (Average) Percent Uncertainty for Spring Constant (k):
= 0.5365%
Average Value of “The Spring Constant” ():
33.595
Final Average Value and Uncertainty for K:
33.595 ±0.5365% or ±0.1781
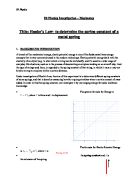
Graph: Oscillation of Spring Vs. Fg (See Graph Paper)
Slope of Graph:
The General Equation for the Ratio for the Spring Tested is: x=0.0311Fg