Results
Raw Data
Processed data
Calculations
All figures with more than 3 decimal places are shown to a smaller degree but the memory of calculator was used in calculations for the sake of accuracy.
Here I will show the workings for the processed data summarized in the previous table.
To find the average time:
Sum of readings / no. of readings
Example
To find the average time from a release of 30 cm. You take the sum of the readings, which are the results from trials 1, 2, 3; which gives (37+25.5+22) / 3 = 28.2 seconds.
In order to find the uncertainty for the average time we have to use the following process: You take the average time and then you subtract it by the highest time. Additionally you take the average time and subtract it to the lowest time. You take the highest difference in the results and you add that to the uncertainty of the stopwatch which is 0.0005seconds.
Example
Average: 28.2
Higher Uncertainty = 28.2 – 37 = 8.8
Lower Uncertainty = 28.2 – 22 = 6.2
Uncertainty for time of 30 cm’s = 8.8 + 0.0005 = 8.8005
= 9.0 seconds (1.s.f.)
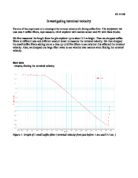
The next step is to calculate the velocity, which can be found by 2 methods. Graphically or using the formula of velocity. We shall first analyze the graphical method:
Graph
Is attached at the back of the lab report.
Using the graph you can also find the average velocity, by calculating the gradient. Since the x-axis represents time and the y-axis being Height (displacement). The gradient is the average velocity.
I used the following formula: ∆ y ÷ ∆ x
Example
Gradient = (60 - 10) ÷ (127.5 – 21)
= 50 / 106.5
= 0.47 but we have to find the inverse so its
= 1/ 0.47 → 2.13
Therefore the velocity using the graph gives us 2.13 ms-1
Secondly we have to look at an alternative method to find velocity so we can have a foundation to comparison. This formula states that velocity can be found using the following formula:
Average Velocity = Displacement / Average Time
Example
To find the average velocity of the basketball from a height of 30 cm’s is calculated accordingly:
Average Velocity (v) = 30 / 28.2
v = 1.06 msˉ¹ (3 s.f.)
As we have recently calculated the average velocity we now have to calculate the uncertainty for it and this can be found using the following formula:
%V = %D + % T
Example
Using the formula above, we can find the % uncertainty of velocity, and hereafter we can calculate the absolute uncertainty
%V = (9.0 ÷ 28.2 x 100) + (0.05 ÷ 30 x 100)
%V = 31.9% + 0.17%
%V = 32.0 %
Absolute uncertainty:
Absolute Uncertainty of V = % Uncertainty x Average ÷ 100%
Abs. unc V = 32.0 x 1.06 ÷ 100
= 0.3392
Therefore V = 1.06 msˉ¹ ± 0.3 msˉ¹
I have shown in my calculations of how I have come to my answers, for averages and uncertainties for time and velocity, using a real example for height 30 cm’s.
The rest of the calculation I did on the calculator and my processed results are summarized in the table below below:
Conclusion
As you can from the processed data in the previous table. We can compare the independent variable x height to time. As we can see through the plotted graph that there linear relationship between time and height. This means that displacement is proportional to velocity. This is found using the formula and the results are summarized in the table above.
At release height of 60cm the velocity is: 1.67± 0.8 msˉ¹
At release height of 90cm the velocity is: 1.93±0.6 msˉ¹
At release height of 120cm the velocity is: 2.19±0.08 msˉ¹
So as calculated per using the formula, we can clearly see through the results that they are proportional.
This can also be seen through the inverse gradient of the graph.
Therefore we can clearly state that being that displacement being constant, time is inversely proportional to velocity.
With a constant of force of Gravity acting upon the ball, and as height is increased, the time taken for the ball to impact the ground will also have to increase. Due to this fact velocity has to also increase. Thus velocity is proportional to distance and inversely proportional to time taken (seconds) to impact the ground.
Evaluation
From the graph we see that the uncertainties of the values for time are really big. My line of best fit cannot incorporate the first and last points. Therefore we can say that there are erroneous data. This clearly suggests that there are random errors. The root of the problem lies within our reflexes. We calculated the time by using a stop watch, and watching when the ball was released and hit. To synchronize the human body and the event is very difficult in terms of accuracy. Also I some-times relied on the sound, to stop my stop-watch rather then actually visually watching it hit the ground. This causes unreliable data also due to the fact that sound travels slower then light.
To improve I could maybe get two laser gateways, which self time using a computer, when the basketball is released and when it impacts the ground. This is a much more accurate result.
Due to this large uncertainty because of the synchronization, we should’ve also taken a larger number of data so we could have a more accurate overall average. And maybe, more people doing the stop-watch simultaneously which will allow us a more accurate reading.
Additionally there may also have been parallax error, caused when the ball has to be fixed to the wall at the x height. It may have been not precise.
To improve we could get a flat surface and place it exactly at the height. And then place the ball above it. And when you remove it, the ball falls, pentrating the laser and starting of the counter. Giving is us all in all much more accurate results. Although, this may be expensive to encourage.