Processing Raw Data:
Sample calculations:
- Calculating mass of water and uncertainties
-
Calculating temperature of water and uncertainties
- Calculating thermal energy
- Calculating average thermal energy
- Calculating uncertainty of the average thermal energy using maximum deviation
Sample Calculation 1. Calculating mass of water and uncertainties:
E.g. (values from burning 0.5g of ethanol in trial 1)
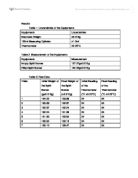
Table 2. Mass of water
Sample Calculation 2. Calculating temperature of water:
E.g. (values from burning 0.5g of ethanol in trial 1)
Table 3. temperature of water:
Sample Calculation 3. Calculating the amount of energy of ethanol transferred to the water:
Steps:
- Convert all masses to kilograms
-
Find energy transferred to the water using,
E.g. (values from burning 0.5g of ethanol in trial 1)
Table 4. Energy transferred from ethanol to water
Sample Calculation 4. Calculating average energy transferred from ethanol to water:
E.g. (values from burning 0.5g)
Table 5. Average energy transferred :
Sample Calculation 5. Calculating uncertainty thermal energy of ethanol:
Steps:
-
- Take the magnitude of both values
- Use the largest value as the uncertainty
- Round to 2 significant figures
E.g. (values from burning 0.0005kg of ethanol)
∴ The uncertainty for the average thermal energy of burning 0.0005kg of ethanol is ± 1232.34 J
Table 6. Uncertainty of average thermal energy:
Processed Data Table:
Table 7. Processed data of average thermal energy
Graphing:
Graph 1. Average slope of energy transferred to the water vs. amount of ethanol burnt
By plotting a graph of energy transferred vs. the amount of ethanol burnt, the gradient displays the energy density of ethanol as the gradient is and the units for energy density is . In this case, the energy density of ethanol is shown to be 14,827,134.91 J kg-1.
Graph 2. Max and min
The above graph shows the maximum and minimum gradient which shows the maximum and minimum result of the energy density of ethanol from this experiment. The maximum value of energy density is 16,785,412.06 J kg-1 and the minimum value is 14,895,228.86 J kg-1.
Conclusion
The experiment shows that the average result of the experiment of the energy density of ethanol is 14,827,134.91 J kg-1. The maximum value of energy density is 16,785,412.06 J kg-1 and the minimum value is 14,895,228.86 J kg-1 shows the uncertainty of this value. The standard, accepted measurement of the energy density of ethanol is 26.8 MJ kg-1 (26,800,000 J kg-1). Therefore, the results of this experiment does not support the standard value as it does not lie between the uncertainty. The average value is only approximately 50% of the standard value. By using the following formula was used to find the percentage discrepancy.
The percentage discrepancy was calculated to be 44.67%. This tells us that our experimental value was 44.67% away from the accepted value.
It is also evident that there is a significant error within this experiment as the average trend line does not pass through all error bars in Graph 1 (the last error bars). Despite that the trend line does not pass through all errors bars, one of the major problems using maximum deviation is that it over estimates the error.
Evaluation:
The results conducted from this experiment is judged to be unreliable as heat was able to easily escape mainly because not 100% of the energy was transferred to the water from burning the ethanol as it is most likely that other objects absorbed the energy or it was lost to the atmosphere. Therefore, the results obtained from the experiment was lower than it should have been. Energy was also lost due to escaping steam particles in the process of vaporisation.
Random errors may that causes heat loss include the length of the wick, which influences the size of the flame. The smaller the flame, the longer it takes to burn and transfer energy which increases the amount of heat that is lost.
Another limitation to this experiment was that when the water was emptied from the beaker, due to reaching a high temperature, the distance between the flame and beaker changes. When the beaker is closer to the flame, the results are higher than they should be, and when the beaker is further away from the flame then the results are lower than they should be.
The combustion reaction was incomplete, meaning that soot was formed and flame is not as strong as it should be. In a incomplete combustion reaction, energy is lost to the soot formed. This error decreases the results that should have been obtained.
Improvements:
As metals are better thermal conductors than glass. By using a metal contain rather than a glass beaker, it may decrease the amount of loss of heat as it is able to accept heat more easily and transfer the energy more quickly. Covering the top of the beaker may also decreases the amount of heat loss as it helps prevents energy from the steam particles to escape.
The distance of between the flame and beaker can be controlled by having a fixed distance between them.
We could also make the combustion complete by providing excess oxygen.
Bibliography
King, B. W. (2009). Ethanol Report. Retrieved from Wiskey and Gunpowder Free Repots: http://whiskeyandgunpowder.com/free-reports/ethanol-report/
Nave, R. (2008). Specific Heat. Retrieved from Hyper Physics: http://hyperphysics.phy-astr.gsu.edu/hbase/thermo/spht.html
Rodrigue, J.-P. (2011). Transportation and Energy. Retrieved from THE GEOGRAPHY OF TRANSPORT SYSTEMS: http://people.hofstra.edu/geotrans/eng/ch8en/conc8en/ch8c2en.html