Data collection:
Table1. Table of u vs v
Table2. Table of u vs v
Table3. Table of u vs v
Table4. Table of u vs v
Table5. Table of u vs v
Data processing:
R = 2f
Table6. Table of u vs v
Standard deviation: = =
The focal length : 10.2004 ± 0.257439
Percentage error:
Table7. Table of u vs v
Standard deviation: = =
The focal length: 10.2415 ± 0.262942
Percentage error:
Table8. Table of u vs v
Standard deviation: = =
The focal length: 16.678 ± 0,184018
Percentage error:
Table9. Table of u vs v
Standard deviation: = =
The focal length : 9.621 ±0.236129
Percentage error:
Table10. Table of u vs v
Standard deviation: = =
The focal length: 16.4392 ± 0, 36243
Percentage error:
Conclusion and evaluation:
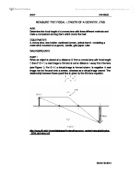
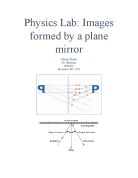
The aim of this experiment is to find the radius of curvature and the focal length of a converging lens by experimental method. The relationship between u, v, and the focal length f for a converging lens is = where f is the focal length of the lens, u is the distance between the object to the lens and v is distance between the images to the lens.
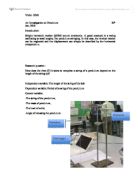
The methods started with set up the apparatus up as shown in the diagram, so that the lengths u and v are equal and so that the image of the candle appears in focus on the screen. Record the lengths u and v. Then, move the candle away from the lens by 5 cm more and adjust the screen distance (v), until the image is one again in focus. Record u and v in the table. Repeat step 3, nine more times (moving the candle further away from the lens). Record u and v each time. Place the candle and screen back in the original position found in step1. Then, move the screen away from the lens by 5 cm more and adjust the candle distance (u), until the image is one again in focus. Record u and v. repeat the same steps of measurements by using different converging lens.
The results in this experiment were quiet pleasing because the percentage error of different types of converging lens in focal length was less than 10%. From the table, the biggest percentage error was 7.2%. Although there wasn’t perfect result which has 0%, our results can be said as excellent rather than other group. However, slight differences were still seen on the results. This is thought to be caused by inaccurate measurements on the distance marker and also on the screen’s image (whether the image is certainly focused or not)
There are several improvements can be made upon this experiment. One such improvement was that it is best to firstly agree upon what will focused images look like on the screen because in some cases, even though the image is not quite focused, the image is considered as being focused and therefore, the measurements might be affected. Another possible improvement was to also run the experiment on a constantly dark room so that it is easier to keep track on the candle light.