Work done by friction
Also
As the height from the weights to the floor is controlled to be constant, and the friction is kept constant by using the same runway, I expect Fweight will be proportional to d.
Method:
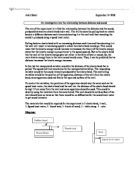
- Set up the apparatus as shown in diagram 1 in the introduction.
- Add weights into margarine tub and fasten them tightly. Record the total mass and keep this mass constant throughout the experiment.
-
Hang 100g (150g, 200g, and 250g) weights on string. (The mass here is the independent variable. And because , I can then get the magnitude of the propelling force)
- Drop the weights from the constant height every time to propel the weighted margarine tub.
-
Record the total forward distance () by the tub. (, this is how I get the dependent variable)
Controlling the controlled variables:
- The total mass of the weighted margarine tub is kept constant throughout the experiment by adding constant weights in it.
- The friction of the runway is kept constant by using the same runway throughout the experiment.
- The height from the hanging weights to the floor is kept constant by recording the height and dropping weights from this height every time.
Collecting the raw data:
The experiment will be repeated 3 times for each of 4 different masses of the hanging weights. (100g, 150g, 200g, 250g)
I select 100g to be my minimum value of the mass of the hanging weights because 50g is too light to propel the weighted margarine tub and make it move.
I select 250g to be my maximum value of the mass of the hanging weights because the runway is too short for the weighted margarine tub to finish travelling under the propelling force from 300g weights.
Results:
Raw Data Table:
Below is a table of the data collected from 3 repeating experiments for each of 4 different masses of the hanging weights.
* The mass of the weighted margarine tub is 0.166, and it is kept constant throughout the experiment.
* The height from hanging weights to the floor is 0.5, and it is kept constant throughout the experiment.
* The uncertainty in mass is estimated to be of the smallest division of the scale (0.0001kg)
* The uncertainty in height is estimated to be of the smallest division of the ruler (0.001m)
* The uncertainty in total distance is calculated from.
Sample calculation (experiment #1 when mass = 0.1kg0.00005kg):
The uncertainty in distance
* Sample calculation for average total distance (experiment #1 when mass = 0.1kg0.00005kg):
Processed Data Table:
* Sample calculation for force (experiment #1 when mass = 0.1kg 0.00005kg):
* Sample calculation for uncertainties within force (experiment #1 when mass = 0.1kg0.00005kg):
Percentage uncertainty
Uncertainty in force
* Sample calculation for average distance (experiment #1 when mass = 0.1kg0.00005kg):
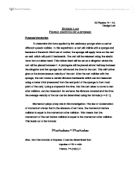
Graph 1: Distance against mass of hanging weights
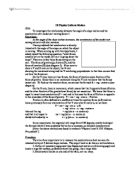
Graph 2: Distance against propelling force
Conclusion & Evaluation:
Conclusion:
From graph 1 it can be seen that within the uncertainties in the experiment distance is proportional to the mass of the hanging weights.
From graph 2 it can be seen that within the uncertainties in the experiment distance is proportional to the magnitude of the propelling force.
Graph 1:
The gradient of the line in graph 1 gives me the value of where h represents the height from the hanging weights to the floor and f represents the friction between the weighted margarine tub and the runway.
Gradient 1, therefore the value of is 3.0667m/kg.
The uncertainty in gradient 1 can be found from the steepest and least steep lines in graph 1:
Maximum value
Minimum value
Uncertainty
Therefore
Graph 2:
The gradient of the line in graph 2 gives me the value of where h represents the height from the hanging weights to the floor and f represents the friction between the weighted margarine tub and the runway.
Gradient 2, therefore the value of is 0.3129m/N.
The uncertainty in gradient 2 can be found from the steepest and least steep lines in graph 2:
Maximum value
Minimum value
Uncertainty
Therefore
Calculating g:
g =
The uncertainty in g = (% error in gradient 1 + % error in gradient 2)g
The accepted value of g established by the third General Conference on Weights and Measures is 9.80665. This lies within the experimental value obtained with uncertainties.
Evaluation:
From the observation of the graph, I can see that all data points lie relatively close to the best fit line although there are some small deviations. Those error bars realistically reflect the uncertainties within the measurements. The conclusion that distance travelled by the weighted margarine tub is proportional to the propelling force exerted on it has been supported by the linear graph. Also the calculated value of g is quite close to the accepted value which supports the accuracy and reasoning of this experiment.
The x-intercept is not very close to the theoretical point (0, 0). Also, I can’t predict the trend of the line as the propelling force goes smaller because the friction force will be larger than the propelling force which prevents the weighted margarine tub from moving. Those results will be unavailable for this experiment.
I have managed to keep the controlled variables constant throughout the experiment although there may be some small deviations within the height from the hanging weights to the floor. I have tried my best to make sure that all measurements take place when the ruler is parallel to the runway to reduce parallax errors.
At the red rectangular area in diagram 1, there is an uncertainty caused by the friction between the string and the corner of the lab table. The friction here also consumes a part of the kinetic energy, which decreases the total amount of kinetic energy gained by the weighted margarine tub.
Also, the string in this experiment is not horizontal, which means it is not parallel to the runway. The angle in between decreases the magnitude of the propelling force exerted on the weighted margarine tub. Therefore the angle causes uncertainties as well.
I have tried my best to make sure that the weighted margarine tub always be propelled from the rest throughout the experiment to avoid uncertainties within the measurements of the distance travelled.
I finished my experiment within the time limit (three classes). However, the range of values and the number of repetitions don’t seem enough for my graph. The reason for the limited range of values is that smaller propelling force can’t make the tub move, and the runway is not long enough for the weighted margarine tub to finish travelling under larger propelling force. I have done my experiment under the largest possible range.
Improvements:
To improve my results, I would try to avoid those uncertainties within my method as shown in diagram 1 that I have mentioned in evaluation. A way to do that is to install a fixed pulley at the corner of the lab table. The fixed pulley will reduce the amount of friction, and also keep the string parallel to the runway. By doing this, I can probably get more accurate results.
My results are also limited by my relatively small number of repetitions of my experiment. More repetitions can definitely make my result more accurate as they may give me a wider data to determine the uncertainties.
To make the uncertainties even less, I would like to choose a totally inelastic string to do the experiment because the stretch of the string may consume energy as well, therefore make the result less accurate.