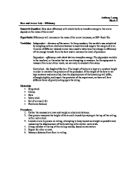
Table 2: Charges Recorded to Two Significant Figures
A graph can be plotted representing the data of the charges:
Graph 1: Charges for Each Drop
Based on the above step graph it can be seen that there are many values close in magnitude. Differences in charges very close to each other can be said to have “small step values”. Based on the data from Table 2, it can be said that the smallest step value is either the difference between drops 2 and 3, or 10 and 11. These are 1.00 E -20, and 7.00 E -21 respectively. Choosing the smallest one and by looking at the table of differences, we are left with our smallest step value: 7.00 E -21.
Although this is not the same value as Millikan’s findings there were some differences in close range, but not the smallest. The closest one being the difference between drops 11 and 12, which was 1.61 E -19.
Data Analysis:
Calculate the mass and charge of one droplet:
Using data from Table 1, values of the charge, plate separation, drop radius and voltage were recorded for one of the droplets.
Charge = 1.48 E -18 C
Plate Separation (r) = 1.870 E -3 m
Drop Radius (r) = 1.089 E -6 m
Voltage = 57 V
In order to calculate the charge (q), the mass (m) must first be calculated using the following formula:
, where r is the drop radius and P is the density of oil.
Density of oil = 926 Kg/m3.
Therefore:
Kg
Now that we have the mass, we can calculate the charge (q) on the same droplet using the following formula:
, where m is the mass of the droplet, g is the gravity (9.8), r is the plate separation, and Vb is the voltage.
C
Therefore the mass of the droplet is: Kg, and the charge on the drop is: C.
Conclusion:
Overall the experiment went well and proper values were recorded. Since no two drops can have the same data, a variety of answers could be correct each within a certain small percent error of each other. Another reason for discrepancy could be due to the fact that different values of P (density of oil) could have been used. However for the most part, the above values have been calculated correctly. To improve such an experiment, one could ensure that everyone uses the same value for P, and as a result more accurate answers can be calculated.
http://hypertextbook.com/facts/2000/IngaDorfman.shtml