Then, the equation V=d/t was used. The velocity was calculated and so was the change of time and the change of velocity. Then all results were recorded in Table 3 Later on, a=ΔV/Δt was used. The acceleration for each time was calculated and recorded in Table 3. Another step was to calculate the uncertainty of the acceleration using the equation: Δa/a= Δv/v+Δt/t. The time, the velocity and the acceleration from the Table 3 were used and the results were recorded in Table 3. The uncertainty of the distance is 1 centimeter and is constant; the uncertainty of time is 0.05 second and also is constant. The uncertainty of velocity and acceleration is not constant.
After recording all necessary datas, the averages of time, velocity, acceleration and uncertainty were calculated- the measurements of each six distances were added and divided by number of the measurements-six. All measurements were rounded to second decimal place.
The next step to measure the acceleration was constructing the graph showing the distance dependence on time (Graph 1). The best-fit line was drawn, so were the line of maximal slope and the line of minimal slope. Then, the Graph 2 showing the average acceleration dependence on time was constructed. The best fit line was drawn. Last step was creating a Graph 3 representing the relationship between given velocities. velocity
In the experiment, the values of air resistance and friction force were neglected, but the air resistance and friction force has influenced the whole experiment.
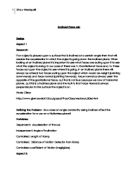
Drawing 1: the incline plane
h-height of the school table
l-length of the school table
Δa=(amax-amin)/2 Δv =(Vmax-Vmin)/2
Δa=(58.60-10.24)/2 Δv=(62.50-24.19)/2
Δa=24.18 Δv=19.55
Graph 1: s(t). Best-fit Line, max and min slope.
Graph 2: a average(t). Best-fit Line.
Graph 3: V(t).The relation between the velocities.
Graph 4: The relation between acceleration and time.
Conclusion:
The constructed graphs prove the hypothesis incorrect. The line touches all error bars, so it means there is a relationship between the linear quantities. The unit of the uncertainty of the distance is expressed in centimeters, the uncertainty of time in seconds and the uncertainty of acceleration in centimeters per second square. The air force and friction has a significant influence on the value of acceleration during the experiment. The conclusions are reasonable.
In the experiment there was error due to the lack of precision of the ruler. It's not possible to be precise using the standard ruler measuring with precision to millimeters. Another possible error can be present due to the inability to see and mark the exact point where the identical distances were. Error also came from inability to know exactly when to stop the timer; also the additional seconds-reaction time of the experimentator. Given errors could cause further errors in calculations of accelerations. All errors have reasonable values. The values of the measurements are similar to each other. The number of repetition is proper.
The fact that the graph doesn't go through the point (0,0) shows presence of the systematic error. As the exact value of air resistance and friction forces were not regarded, the error could occur. There also could be the error due to the slight change of levels because of soft cover of Giancoli.
As all experiments, this one also involve errors and can be improved. The uncertainty could be reduced, the millimeter paper could be used instead of the ruler, hard cover instead of Giancoli. Considering air resistance and friction force could help with estimating particulars. The usage of more precise timer could also improve our measurements and further analysis. More readings could give better results and therefore improve the whole experiment. The fact that the inclined plane had a low angle could also change the expected results; if the inclined plane were higher, the results would be more precise.
Not including and using in calculations the values of air resistance and friction force has influenced the calculation, and what follows, the results of the experiment. If the values of air resistance, fraction force and other variables were considered and therefore calculated, it would show, that our experiment was done correctly.