= ; change in resistance
= Since ∆V=∆I=0.01
For a resistor to be Ohmic, the graph of the plotted V-I readings:
- Must pass through the origin
- V and I must be directly proportional.
For Ohmic resistors, V=IR
Where V= Drop in Voltage, I = Current, R = Resistance.
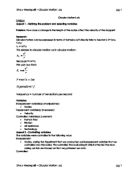
DCP Graph 1.1 – Graph showing the plotted readings for the bulb filament immersed in water with the ammeter reading (A) on the y-axis and the voltmeter reading on the x-axis and line of best fit. Error bars cannot be shown as the magnitude of error ≈ (1 – 5)% is insignificant on the graph.
Graphical Observations:
- The graph does not pass through the origin
- The plotted V-I values are directly proportional, with a slight deviation which can be accounted for by errors.
DCP Graph 1.2 – Graph showing the plotted readings for the bulb filament immersed in water with the ammeter reading (A) on the y-axis and the voltmeter reading on the x-axis and showing line of best fit. Error bars cannot be shown as the magnitude of error ≈ (1 – 5)% is insignificant on the graph.
Graphical Observations:
- The graph passes through the origin
- The plotted V-I values are directly proportional, with a slight deviation which can be accounted for by errors.
Calculation of Resistance,
≈ R = 0.16 Ohms
Uncertainty Calculation:
% Error in Voltmeter Reading = x 100
= 12.5%
% Error in Ammeter Reading = x 100
= 2%
Therefore, % Error in Resistance = % Error in Ammeter Reading + % Error in Voltmeter Reading
= 14.5%
This has been done for all readings and shown in the tables below:
DCP Table 1.3 – Table showing the values of resistance (ohms) for the corresponding V and I value using the formula R = V/I for the bulb.
DCP Table 1.4 – Table showing the values of resistance (ohms) for the corresponding V and I value using the formula R = V/I for the bulb filament immersed in water.
Conclusion and Evaluation:
CE Graph 1.1 – Graph showing the plotted readings for the bulb with the ammeter reading (A) on the y-axis and the voltmeter reading on the x-axis and line of best fit. Error bars cannot be shown as the magnitude of error ≈ (1 – 5)% is insignificant on the graph.
From DCP Table 1.3 and Graph 1.1, we have proved the bulb filament to be non-Ohmic.
CE Graph 1.2 – Graph showing the plotted readings for the bulb filament immersed in water with the ammeter reading (A) on the y-axis and the voltmeter reading on the x-axis and showing line of best fit. Error bars cannot be shown as the magnitude of error ≈ (1 – 5)% is insignificant on the graph.
From DCP Table 1.4 and Graph 1.2, we have proved the bulb filament to be Ohmic where the deviation can be explained by errors.
Uncertainty Propagation
Systematic Errors:
There is no literature value to compare our calculated Resistance to, for a better understanding of the accuracy of our experimentally calculated resistance.
The procedure involves using a light bulb, which when an electric current passes through it begins to heat up. Since, temperature is a factor affecting resistance, a drawback of the procedure is that we get an error due to this increase in temperature of the light bulb filament which is not quantifiable.
In the case of the bulb filament, this error is not significant in affecting the readings as water has a very high specific heat capacity and absorbs any heat evolved. This cannot be done for the bulb as due to the glass covering and it being filled with an inert gas, the filament still heats up.
The formula for calculation of resistance imply standard temperature and pressure i.e. 273K and 1 atmosphere of pressure. However, my experiment was carried out in a temperature in excess of 403K accounting for a deviation from the actual value.
The Internal resistance of the battery source was not provided and hence it is an error that is not quantifiable.
The measuring apparatus i.e. the ammeter and the voltmeter are assumed to be ideal.
Random Error:
The experiment had to be re-done after the first light bulb filament blew due to an excess of voltage passing through it.
The readings of the apparatus consistently fluctuated, resulting in me using a mid-value between 2 fluctuating values.
Suggestions for Improvement:
A calibration of the apparatus so that the readings do not fluctuate.
A better comparison could have been the filament immersed in water V-I readings compared to a filament in air and the comparison of the effect of temperature on resistance. However, a filament glowing brightly in air is detrimental to our eyesight.
A comparison with a literature value would have lent a better understanding as to the accuracy of the experiment.
The experiment should have been carried out at standard conditions of temperature and pressure (i.e. 273K and 1 atm) in a controlled environment.