ln () = ln (
ln () = ln () + ln ()
ln () = ln () + ln ()
This is now in the same form as the equation for a straight-line:
Thus, if we plot ln () on the y-axis and ln () on the x-axis we will get a straight-line graph.
The gradient will be equal to. The y-intercept will be equal to ln () [so =]
Since the log graph is going to be a straight line graph in that case it will be easy to find the mathematical constants which are the aim of the experiment.
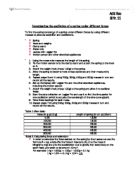
Apparatus: Two meter rules, adjustable clamp, weights, and a metre ruler.
Procedure: Refer to the lab sheet.
Variables:
Independent variable – Depression of the beam (x)
Dependant Variable - The length of the beam (l)
Controlled Variable – The mass of W (load)
DATA COLLECTION
Quantitative Data:
Table of Results:
Graph of Beam 1:
Gradient of the best-fit line:
=
=
= =
Measurement: 1.04 ÷ 0.32 =3.25
Relative error of a: 0.02 ÷ 1.04 = 0.01923076923
Relative error of b: 0.02 ÷ 0.32 = 0.0625
Sum of Relative errors: 0.01923076923 + 0.0625 = 0.08173076923
Absolute Uncertainty: 0.08173076923 × 3.25 = ± 0.265 ≈ ± 0.3
Final Answer: 3.3 ± 0.3 (gradient)
Hence, is equal to 3.3 ± 0.3
Y-intercept will be equal to ln() [so =]
Hence, = ]
The y- intercept is -10.36,
Graph of Beam 2:
Gradient of the best-fit line:
=
=
= =
Measurement: 0.95 ÷ 0.28 = 3.392857
Relative error of a: 0.02 ÷ 0.95 = 0.0210526315789474
Relative error of b: 0.02 ÷ 0.28 = 0.0714285714285714
Sum of Relative errors: 0.0210526315789474 + 0.0714285714285714 = 0.0924812030075188
Absolute Uncertainty: 0.0924812030075188 × 3.392857 = ± 0.313 ≈ ± 0.3
Final Answer: 3.4 ± 0.3 (gradient)
Hence, is equal to 3.4 ± 0.3
Y-intercept will be equal to ln() [so =]
Hence, = ]
The y- intercept is -10.89,
Conclusion:
From the graphs, I can conclude that the depression of the cantilever beam is not affected by the change of weight. This is further proved by the gradients of the graphs because they are almost equal, with only a slight difference of 0.1. This may be due to errors made while carrying out the experiment.
Evaluation:
Limitations of the experiment:
- The time allocated for the experiment was not enough for repeating the experiment to get more readings.
Weaknesses of the experiment:
- The rulers used were not calibrated properly.
- The rulers were bent; hence it will affect the length of depression.
Possible sources of error:
The possible errors that were made were parallax errors when taking the readings.
Possible improvements to the experiment:
- More time should be allocated for the experiment so that the experiment could be repeated to get more accurate results.
- Proper Calibrated Meter Rulers should be used.
- Meter Rulers which are straight and not bent should be used.