Apparatus needed:
- Temperature sensor to able to take temperature readings at different stages.
-
Shovel in order to dig.
- Gloves in order to keep hands clean.
- Clipboard to right on.
- Pen and paper to record readings.
- GPS unit to measure the altitude.
Method of experiment:
- Find an area next to the water where there will be no sun or only a little bit of sun at all times of the day.
- Put your cloves on in order to keep them as clean as possible.
- Stick the temperature sensor into the soil right at the surface to get the temperature of the surface.
- Start digging and go as deep as you can or would like for you experiment.
- Measure the depth of the soil with the ruler. Once you have dug enough, stop digging.
- Place the temperature sensor into the probe horizontally at different depths and record your readings.
-
Find an area far away from the water where there will be no sun at all times of the day.
- Repeat steps 2, 3, 4, 5, 6.
- Clean and wash your hands.
Method of Collecting Data:
- Use the same temperature sensor so that you keep your investigation a fair test i.e. to control one of your variables.
- Look at the light intensity in your Temperature sensor if it has one in order to maintain the same light intensity when you are looking for your next area i.e. to control the other controlled variable.
- When digging go down as far as 40 cm.
- Take readings at 4 cm intervals in order to identify a regular trend in temperature difference.
- When finished use the GPS to look at the altitude at the different area.
- Draw up a table showing your results.
- Calculate the difference in temperature.
- Draw a graph of the difference in temperature.
Data Collection and Processing
Data collection:
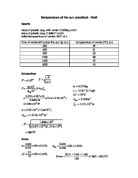
Table showing the temperature at different depths of the soil that is closer to the water. (All readings to 1 decimal place)
Table showing the temperature at different depths of the soil that is closer to the water. (All readings to 1 decimal place)
Data processing:
Because we are only really looking at the difference in temperature and we didn’t take many readings, there isn’t much we could do in terms of processing the data. However, to make the comparison easier and more worthwhile we will look at the temperature difference between the two soils. I subtracted the temperature of the second soil from the first soil:
Temp of soil near water- Temp of soil away from water.
Table showing the temperature difference between the two soils. (All readings to 1 decimal place)
Data presentation:
This graph presents the temperature difference between the two soils and essentially helps us to see the correlation.
Conclusion and Evaluation
Conclusion: In essence, the results that we collected support my conclusion. This is true because we could see – by looking at the tables- that as we increased in depth the temperature of the soil decreased. This is explained by the fact that at the surface, the soil is warmed up by the air whereas as we go down, less air enters and less thermal energy transfers occur. Furthermore, the data also supports my prediction that near the water the soil will be warmer due to the fact that the water will be warmed by the sun and as it enters the soil it will in turn warm the soil. Finally, it is interesting to look at the graph showing the difference in temperature because as we can see we get a somewhat straight line which suggests that as we increase the depth of soil, the temperature change is the same regardless of the place. This could suggest that the water increases the temperature of the whole soil but doesn’t play a role in the decrease of temperature as we increase the depth of the soil. Our results may have been inaccurate due to the different errors that we had which could have obviously distorted our readings. First of all, random errors occurred because we may have had parallax errors when trying to hold the probe vertically due to the fact that the hole was small and it was hard to see how it was going in. Also, the ruler may have not been held straight when taking different depths again distorting our readings. In terms of systematic errors the temperature sensor may have shown misleading results.
Evaluation: There were obviously several weaknesses and limitations in our experiment that didn’t allow us to gain more relevant information. First of all, one of the limitation is that we couldn’t dig further because of the time we had and because our equipment wasn’t good enough for in-depth digging. Furthermore, because of the lack of apparatus, we couldn’t dig the two holes at the same time, thus our readings may have been distorted because further in the day the atmosphere may have become warmer. Another limitation is that we couldn’t dig very big holes not only in depth but in width so that we could go into them and make it easier to place the temperature sensor, therefore reducing the parallax error.
In terms of weaknesses in our experiment, it would have been much more convenient digging three holes in each area (or more) in order to calculate averages to get much more accurate results but time constraints didn’t allow for this. Another weakness was that the soils where we dug were at different altitudes. The one next to the water was at an altitude of 176m whereas the one far away from the water was at an altitude of 189m.
Improvements: There are several improvements that can be made to make this investigation more reliable and relevant. First of all, to oppose our main weakness, it is essential to take more readings i.e. dig more than one hole and repeat the experiment to get averages. Furthermore, it would be good if more than temperature probe existed because then the temperature readings would be taken at the same time. Consequently, time would become a controlled variable. Finally, it would be convenient to use a spirit level to make sure that our ruler is always held straight and hence this would reduce our random errors.