(all the data is rounded to the 2nd decimal place)
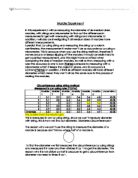
The measures recorded from the ground and Third floor were combined to create a big set of data. The data is sorted in ascending order.
The average of all these times is approximately 1.28 seconds.
The lowest measure (1.12 sec) is 0.16 seconds below the average, while the highest measure (1.65 sec) is 0.37 seconds above the average.
The average of these two is approximately 0.27 seconds and so the time could be written as 1.28 ± 0.27 seconds.
This is a way which is too broad and imprecise in trying to find an accurate measure. There needs to be refinement in the data because if one looks at the data of the times measured from the third and ground floor one will find that there are many random errors with too many measures which are too big and too small. These errors in timing were most likely caused by the person’s reaction when timing. These errors can be easily be deciphered on a graph (next page).
These errors increase inaccuracies of the final result and therefore the data has to be reduced to a more accurate set of data. The best way to eliminate errors is by downsizing the number of data to the measures found between the lower and upper quartile (divides the data into four).
To find these quartiles you need to
- list the data (all the times measured from the ground and third floor) in order
- there are 42 numbers so the median is in position 21.5 : Median = 1.265
- The middle of the set of numbers below the median is the lower quartile: Lower quartile = 1.22
- The middle of the set of numbers above the median is the upper quartile: Upper Quartile = 1.34
So therefore in the manipulated data it will have all the numbers between 1.22 and 1.34.
The average of the Times is approximately 1.27 seconds.
The lowest measure of this set of data (1.22) is 0.05 sec below the average, while the highest measure of this set of data (1.34) is 0.07 sec above the average.
The average of these two is 0.06 sec and so the time could be written as
1.27 ± 0.06 sec.
Looking at the graph of the manipulated data it looks like there are still some random errors in these measures and the average 1.27 has an uncertainty of ± 0.06 sec. which is still not the most accurate result possible to get. So the same process which was done to find the first manipulated data will be done again. In order to refine this manipulated data the quartiles need to be found again.
There are 27 numbers so therefore the median is in 13½ place: median = 1.27 approx.
The lower quartile is approximately 1.23 and the upper quartile is approximately 1.28. So therefore in this second manipulated data there will be numbers between 1.23 seconds and 1.28 seconds
The average of the times is approximately 1.27 seconds
The lowest measure (1.23) is 0.04 seconds below average and the highest measure (1.28) is 0.01 above average.
The average of these two is approximately 0.03 seconds and so the time could be written as 1.27 ± 0.03 seconds.
Conclusion and Evaluation
Uncertainties for measurement of time is decided when a measurement is too big or too small to the other data.
Most of the causes of the errors which gave anomalous results are most likely the cause of the human reaction when timing a ball. A human will rely mostly on its auditory and visionary perception during such an experiment. The speed of light is much faster than the speed of sound therefore one should rely more on one’s sight during such an experiment but hearing the impact of the ball on the ground is the signal that one would instinctively wait for before stopping the stopwatch. Therefore this means there will be more inaccuracies if one depends mostly on the auditory perception than on the vision.
During the experiment some of the students dropped the ball before the given signal or they stopped the stop watch before the ball hit the ground.
The position of the ball (although the ball was set at a certain point on the third floor) might change by a few millimetres changing the distance of the ball’s flight in a tiny way.
The stopwatch since it measured to the 1/100 of a second was a strong inaccuracy for this kind of experiment. These kind of experiments which measures precise spaces of times less than 30 seconds are not very helpful when using a stopwatch, and it is better to use an electronically watch. The results are very inaccurate using a stopwatch because there are many errors caused mainly by the person’s reaction-time.
When narrowing down my data the uncertainty decreased as well, this therefore means that my technique of manipulating my data was successful. All I did is to keep subtracting all the anomalous data from the previous data. I f I had continued the process I would have gotten and even more precise answer with an uncertainty of ± 0.01 seconds. Still that answer would still not be fully accurate.
In order to gain to strongest accuracy in results the following should be suggested:
- Use a more precise apparatus to measure the times such as an electrical watch which measures to more than a 1/100 of a second.
- Collect as much data as possible
- Improve the reaction time when letting go of the ball on time and timing the impact of the ball as it hits the ground, so there would be less uncertainties
- Do the experiments in some other place or environment because the space in which the ball was thrown was very narrow and decreased the ability of using vision as a sense to help measure time. Maybe if this experiment was done in an open space it would be easier to use on senses, away from other distractions.
- Using only one Tennis ball would reduce the errors in the results if ever these different balls had different air resistance.