Controlled Variables-
-
Environment: The experiments were performed in the same part of the classroom and this ensured more accurate results. There was no wind to affect or assist the cart in its movement across the horizontal track. Since the environment was kept constant factors such as air pressure and elevation were also controlled.
-
Horizontal Track: The track where the cart travelled across was also kept constant for all trails performed. This was maintained by the using the same track for all trails, this ensured no extra friction to be added and no difference in the slope of ramp.
-
Mass of Cart: The mass of the cart was kept constant because the difference in mass could possibly cause a difference in the gravitational force acting on the cart. The same cart is used to eliminate sources of error and efficiency.
-
Timer: The timing of how long it took the cart to travel across the horizontal track was kept constant. The method of timing was not changed and controlled by the spark timer which had a constant setting of 10Hz (10 dots /s).
-
Ticker Tape: The same type of tape was attached to the end of the cart, keeping the position of the ticker tape constant with ensure that the tension is kept constant. The tape was controlled by using the same length, and same material for all trails.
Materials:
- Ramp
- Horizontal Track
- Car
- Spark Timer
- Ticker Tape
- Meter Stick
Procedure:
- Set up the ramp and horizontal track to your desired height, but do not make it too high or it will be too fast, therefore you will have less data.
- Run the ticker tape through the spark timer then tape it to the car.
- Place the car at the top of the track.
- Turn the spark timer on.
- Let the car go down the ramp.
- Turn the spark timer off once it has reached the bottom.
- Take off the ticker tape and begin to record your data.
- Repeat steps 2-7 for additional trials.
Observations:
- Meter stick is wood and brown in color.
- The track is made of wood and fairly smooth
- Cart was made out of metal
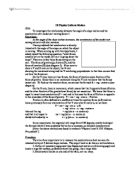
Table 1.0 - Displacement of a Cart as a Function of Time
Graph 1.1 Displacement as a function of Time
The Slope represents the velocity of the cart
Sample calculation for slope:-
Slope= (y1-y2) / (x1-x2)
Y1= 0.5808m Y2=0.2112s
X1=0.33s X2=0.12s
Slope= (0.5808m-0.2112m) / (0.33s-0.12s)
= 0.3696m / 0.21s
= 1.76 m/s
Slope=Velocity
Table 1.3 Velocity as a function to Time
Analysis:-
Velocity calculated by the formula
- V=0.187m/0.1s
V=1.87 m/s
- V=0.352m/0.2s
V=1.76m/s
- V=0.529m/0.3s
V=1.76m/s
- V=0.702m/0.4s
V=1.76m/s
- V=0.872m/0.5s
V=1.74m/s
- V=1.034m/0.6s
V=1.72 m/s
Evaluation:-
As predicted, the velocity throughout the experiment remained relatively the same. Since the cart travelled with uniform motion, the velocity remained the same and was not affected greatly, except for slightly at the beginning and close to the end of the experiment. The cart accelerated until it went down the horizontal track and began to move at a constant speed, which we can see in our velocity-time table, as the first velocity is the highest. The constant speed will then maintain its self for a certain amount of time before it gradually slows down due to different forces applying on it, which we also see in our velocity time table as our velocity gradually began to decrease at 0.5 and 0.6 seconds. When the slope was calculated of the distance-time graph, it was the same as the velocity, because the slope of a distance time graph calculates to the velocity. The distance between our ticker tape dots was approximately the same, and this also shows us that the speed of the cart is approximately constant.
Possible sources of error that occurred in this experiment include the ticker tape not being pulled at the same angle as the cart, which meant it was travelling less distance than the cart and this reduces the accuracy of the lab. There is also the possibility of human error in recording the distance between the dots on the ticker tape, since it was not measured to precise accuracy, and the person measuring it could have measured the dots below or above eye level, reducing the accuracy. The cart also did not travel in a straight line down the incline or the horizontal track, and it also bumped and turned slightly at an angle when hitting the meeting point of the two ramps. There is also friction and the ticker tape applying force on the cart, making it slow down.
Ways to reduce the errors in this lab could be to attach the ticker tape to the cart in a way that it would not move at an angle to it, but rather it would take the exact same path as the cart. To reduce the possibility of human error, 2 or 3 people should measure the distances for more accuracy in the results, at eye level. At the intersection of the inclined ramp and horizontal ramp, they should be attached in a more suitable way so that it does not cause the cart to bump and move at an angle, but rather to go smoothly over it. Also to reduce the force of friction slowing the cart down, an air track apparatus should be used. Furthermore to increase the overall efficiency of the lab, more trials should be conducted.