Moreland and McMinn (1999) conducted a study involving splitting university student’s in to groups of six to participate in a team-building task; these groups were then split again to make groups of three, who then had to deign a poster. Each group’s posters were then evaluated by other groups. They found that the group members reported being more distressed and having feelings of rejection when they were criticised by an ex in-group member, than when they were criticised by unrelated groups. This study contradicts what has been previously been found and suggested by social identity theory, like Hornsey et al this study planned to look at the effect of criticism coming from either in-group or out-group members (not ex in-group members like Moreland and McMinn, as its difficult to determine whether the current in-group member views the criticism as coming from an in-group or out-group member.) When conducting their study Hornsey et al found that “out-group critics were evaluated less positively than in-group critics and their comments aroused greater sensitivity than did the very same comments when made by an in-group member” (J. Hornsey et al 2002) in order to either back up or contradict the evidence from Hornsey et al’s experiment this study aimed to find if in-group members have different responses to criticisms dependent upon if its given form either the in-group or the out-group. Its purpose was to replicate the inter-group sensitivity effect.
Hypothesis
It was predicted that participants would be significantly less sensitive to the criticisms given if they believed them to come from an in-group critic than if they believed they came from an out-group critic. Any difference in the dependant variable (response to criticism) would be as a direct result of the independent variable (where the criticism stems from) and not chance.
Method
The aim of the study was to make a replication of Hornsey et al’s (Hornsey et al, 2002) findings. The study aimed to monitor an in-groups reaction to criticisms from both within the in-group and from an out-group. The study predicted that participants would be significantly less sensitive to in-group critics than to out-group critics, any difference in the dependant variable (how sensitively the participant reacted to criticism) would be as a direct result of the independent variable (Whether the participant believed the criticiser to be a member of the in-group or the out-group) and not chance.
Participants
An opportunity sample of 50 students from Keele University both male and female (31 female, 19 males) of an average age of 19.58 were selected to participate in the experiment. They were selected on the basis that they were all students and therefore members of an in-group of students. The two groups did not differ significantly in age or sex. An opportunity sample was chosen as it was a good way to gain a random sample from the target population.
Materials
The stimuli used in this experiment were taken from Elder, Douglas and Sutton (2005). Below are the stimuli presented for the in-group and out-group condition:
In-group member (Student)
David Sanderson is a 20 year-old second year undergraduate student. When asked what he though about students, he made these comments:
“Most of us are from privileged, middle-class backgrounds, but we expect the taxpayer to support us. Many of us just drift into university because of parental pressure or simply because we want to get drunk and party. About 50% of students show up to the average lecture and seminar; much of the absenteeism is down to the fact that we’re either spending our time and money in the pub, or were hung-over from the night before”.
Out-group member (Non-student)
David Sanderson is a 20 year-old office manager who decided against going to university. When asked what he though about students, he made these comments:
“Most students I know are from privileged, middle-class backgrounds, but they still expect the taxpayer to support them. Many of them just drift into university because of parental pressure or simply because they want to get drunk and party. About 50% of students show up to the average lecture and seminar; much of the absenteeism is down to the fact that they’re either spending their time and money in the pub, or they’re hung-over from the night before.”
Upon what the participant read they were then required to score their feelings and the strength of these feelings on a Likert scale. The Likert scale was used in order to rate the participants perceptions of the speaker. The Likert scale allows respondents specify their level of agreement to a statement. It’s a successful way of measuring people’s attitudes towards a statement and how strongly the views they hold are. Means of the scores recorded were taken in order to reach a conclusion on the overall attitude of the in-group member towards the commenter. The questionnaires used can be found in the appendix fig.1.
Design
An independent measures design was used, the participants only provided data in one experimental condition. The study was also single-blind. In that the two groups believed they were completing the same questionnaire when they were in fact completing two different questionnaires. The participants were randomly allocated to separate sides of the room, which indicated their groups. Attempts were made to make the groups even in both numbers and gender. The independent variable involves whether the participant believed the criticiser to be a member of the in-group or the out-group and the dependant variable is how sensitively the participant reacted to criticism.
Procedure
Upon entering the experimental room set up with tables at separate sides, participants were separated randomly to either of the two sides of the room. They were then administered with two separate questionnaires. The experimental group were given the questionnaire where the stimuli was of the speaker belonging to the in-group and the experimental group were given the stimuli of the speaker belonging to the out-group. The participants were given instructions to read through all of the information presented on the questionnaire and then fill in the Likert scales on a scale of one to seven (one not thinking the comments were at all and seven thinking the comments were very much) asking about feelings of to what level they thought the comments made were; threatening, disappointing, irritating, offensive, insulting, hypocritical, judgemental and arrogant. They were given 10 minutes to do this before the experimenters collected the questionnaires in. At the end of the experiment participants were fully debriefed by the experimenters and informed as to the true aim of the experiment.
Results
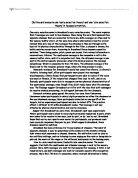
In order to convert the raw data gathered from the questionnaires the means of the scores given by each participant from both the experimental and the control groups were calculated. The overall mean was then calculated for the sensitivity of each group. The results of the mean for each participant can be found in the appendix fig 2. The overall mean for the sensitivity to the comments made for the control group (in-group commenter) was 4.4868 and the overall mean for the experimental group (out-group commenter) was 3.8352.
The standard deviation for each group was also calculated in order to make a comparison between the two results and determine if there was a level of significance between the two groups. The standard deviation worked out at 1.1501 for the in-group critic group and 0.9516 for the out-group critic group. This implies that there is a significant difference between the sensitivity of the responses of each group. The control group was less sensitive to the comments made than the experimental group. The calculation for the standard deviation can be found in the appendix fig.3. Table 1 presents the means and standard deviations of both groups.
Table 1. Means and standard deviations of the level of sensitivity to each critic in each condition.
The experiment used an independent design, in that each participant reported their sensitivity to the criticisms made either by an in-group or out-group commenter. This design involves the responses of each group being statistically independent of each other. In order to compare two statistically unrelated means it is necessary to use an independent t-test. As the hypothesis used was directional, a one-tailed independent t-test was used. By using an independent t-test t analyse the results of the study it’s possible to see if the difference between two independent means is bigger than expected according to variation alone. The formula for the independent t-test can be seen in the appendix fig.4. The result of the t-test showed that the group with the out-group critic was significantly more sensitive to the criticisms than the group with the in-group critic, t (48) = 2.1204 p< 0.05. This shows that the results found were significant and the probability of the results found being due to chance is less than 0.05.
Discussion
The results of the experiment revealed that when receiving criticism from an in-group member, groups are less sensitive to it and take it more positively than they would if the criticism was to come from an out-group member. The results of the experiment therefore support the hypothesis (that participants would be significantly less sensitive to the criticisms given if they believed them to come from an in-group critic than if they believed they came from an out-group critic. Any difference in the dependant variable (response to criticism) would be as a direct result of the independent variable (where the criticism stems from) and not chance.) These results also add fuel and back up the results found by the experiment conducted by Hornsey et al (it’s ok if we say it but you can’t) as discussed in the introduction.
The results when combined with the results of that of Hornsey’s experiment are successful in providing evidence for the theory of inter group sensitivity effect and suggests that groups do receive criticism in different ways dependant upon whether the critic is a member of the in-group or an out-group. From this we can adopt the theory of social identity and assume that this is done in an attempt to protect the identity and status of the in-group by rejecting the out-groups criticisms.
These results can be viewed as generalisable to the participants involved as it shows their true views on a particular statement when they were not informed as to the true aim of the experiment. They’re also useful in giving an idea of the affect of an in-groups reaction to criticism. However the results could also be interpreted as not being generalisable to the target population of all group members for numerous reasons. For example the experiment was only conducted with university students, who are not representatives of the whole of society, nor were the participants representative of university students in general as an opportunity sample was used, meaning not all members of the target population had an equal chance to be involved in the experiment. Evidence of this can be seen in the ratio of males to females being unequal, proposing that there wasn’t perhaps a proportionally equal amount of male participants available at the time of the study. It’s also difficult to generalise these findings from one in-group to the next. Here we have an example of a group of people in university however there are many varying forms of groups both in size and type and other groups may not react in the same way to criticism as was found in this experiment. All of the above biases could lead to unreliable and un-generalisable results.
This study implies that there is a significant difference in the way groups respond to criticism depending upon where the original criticism stems from, it would be useful to design an experiment which is less narrow and can provide an overview of the responses of numerous types of varying groups. From the results of the study and the supporting results from which the study was replicated, Hornsey et al we can generally assume in line with the theory that criticism does affect groups differently, suggesting that individuals have an innate tendency to protect the identity of the organisations and groups to which they belong. Like the research of Hornsey et al this study also contradicts the findings of that of Moreland and McMinn (1999) and it’s possible that it does so for the same reasons, that the groups In this case were naturally occurring and not shifted, however it is not possible to control the previous backgrounds and experiences of the participants which may affect their opinions towards the critics.
References
Hornsey MJ, Oppes T, Svensson A, (2002) “’It’s ok if we say It but you can’t’: responses to intergroup and intragroup criticism” in European Journal of Social Psychology (32) 293-307
Nemeth C, Owens P. “Making work groups more effective: The value of minority dissent”. In The Handbook of Workgroup Psychology, West MA (ed.) Wiley: Chichester; 125-141
Hornsey MJ, Imani A (2004) “Criticizing groups from the inside and the outside: An identity perspective on the intergroup sensitivity effect” In the Society for Personality and Social Psychology, Inc. (3) 365-383
Tajfel H (1982) “Social psychology of intergroup relations” Annual review of psychology (33) 1-39
Appendices
Fig.1 –Questionnaire’s and stimulus’ administered to the participants
People’s Perceptions of Personality Types
Information and instructions to participants
This study is examining people’s perceptions of personality types. You will be presented with a series of comments on the subject of students’ personalities and behaviour. The comments were spoken by someone who decided against going to university.
Please answer the following questions below, thank you.
AGE: ----------------------------
GENDER: Male Female (Please circle)
Speaker’s Comments:
David Sanderson is a 20 year-old office manager who decided against going to university. When asked what he though about students, he made these comments:
“Most students I know are from privileged, middle-class backgrounds, but they still expect the taxpayer to support them. Many of them just drift into university because of parental pressure or simply because they want to get drunk and party. About 50% of students show up to the average lecture and seminar; much of the absenteeism is down to the fact that they’re either spending their time and money in the pub, or they’re hung-over from the night before.”
Speaker Evaluations:
Below is a list of words that could be used to describe the speaker. Please respond to the following statements by circling a number between 1 and 7 on the scale.
To what extent do you think the comments were:
Not at all Very much
1. Threatening 1 2 3 4 5 6 7 2. Disappointing 1 2 3 4 5 6 7
3. Irritating 1 2 3 4 5 6 7
4. Offensive 1 2 3 4 5 6 7
5. Insulting 1 2 3 4 5 6 7
6. Hypocritical 1 2 3 4 5 6 7
7. Judgemental 1 2 3 4 5 6 7
8. Arrogant 1 2 3 4 5 6 7
Thank you.
People’s Perceptions of Personality Types
Information and instructions to participants
This study is examining people’s perceptions of personality types. You will be presented with a series of comments on the subject of students’ personalities and behaviour. The comments were spoken by someone who attends university.
Please answer the following questions below, thank you.
AGE: ----------------------------
GENDER: Male Female (Please circle)
Speaker’s Comments:
”. David Sanderson is a 20 year-old second year undergraduate student. When asked what he though about students, he made these comments:
“Most of us are from privileged, middle-class backgrounds, but we expect the taxpayer to support us. Many of us just drift into university because of parental pressure or simply because we want to get drunk and party. About 50% of students show up to the average lecture and seminar; much of the absenteeism is down to the fact that we’re either spending our time and money in the pub, or were hung-over from the night before
Speaker Evaluations:
Below is a list of words that could be used to describe the speaker. Please respond to the following statements by circling a number between 1 and 7 on the scale.
To what extent do you think the comments were:
Not at all Very much
1. Threatening 1 2 3 4 5 6 7 2. Disappointing 1 2 3 4 5 6 7
3. Irritating 1 2 3 4 5 6 7
4. Offensive 1 2 3 4 5 6 7
5. Insulting 1 2 3 4 5 6 7
6. Hypocritical 1 2 3 4 5 6 7
7. Judgemental 1 2 3 4 5 6 7
8. Arrogant 1 2 3 4 5 6 7
Thank you.
Fig.2 Raw data for mean scores of individual participants
Fig.3. Standard deviation formula.
Fig. 4. t-test formula.